2450 Bay Hill Dr Fairfield, CA 94534
Rancho Solano NeighborhoodEstimated Value: $634,156 - $735,000
4
Beds
2
Baths
1,750
Sq Ft
$390/Sq Ft
Est. Value
About This Home
This home is located at 2450 Bay Hill Dr, Fairfield, CA 94534 and is currently estimated at $682,789, approximately $390 per square foot. 2450 Bay Hill Dr is a home located in Solano County with nearby schools including Suisun Valley Elementary School, Angelo Rodriguez High School, and Solano Christian Academy.
Ownership History
Date
Name
Owned For
Owner Type
Purchase Details
Closed on
Mar 27, 2012
Sold by
Damm Janet L and Morrison Catherine
Bought by
Trockey Melissa L
Current Estimated Value
Home Financials for this Owner
Home Financials are based on the most recent Mortgage that was taken out on this home.
Original Mortgage
$339,000
Outstanding Balance
$234,151
Interest Rate
3.91%
Mortgage Type
New Conventional
Estimated Equity
$448,638
Purchase Details
Closed on
Jul 12, 2010
Sold by
Damm Vernon
Bought by
Damm Janet L
Home Financials for this Owner
Home Financials are based on the most recent Mortgage that was taken out on this home.
Original Mortgage
$339,429
Interest Rate
4.76%
Mortgage Type
FHA
Purchase Details
Closed on
Jun 16, 2010
Sold by
Haight Allan H and Lingemann Linda S
Bought by
Trockey Melissa L and Morrison Catherine
Home Financials for this Owner
Home Financials are based on the most recent Mortgage that was taken out on this home.
Original Mortgage
$339,429
Interest Rate
4.76%
Mortgage Type
FHA
Create a Home Valuation Report for This Property
The Home Valuation Report is an in-depth analysis detailing your home's value as well as a comparison with similar homes in the area
Home Values in the Area
Average Home Value in this Area
Purchase History
| Date | Buyer | Sale Price | Title Company |
|---|---|---|---|
| Trockey Melissa L | -- | Old Republic Title Company | |
| Damm Janet L | -- | Fidelity National Title Co | |
| Trockey Melissa L | $344,000 | Fidelity National Title Co |
Source: Public Records
Mortgage History
| Date | Status | Borrower | Loan Amount |
|---|---|---|---|
| Open | Trockey Melissa L | $339,000 | |
| Previous Owner | Trockey Melissa L | $339,429 |
Source: Public Records
Tax History
| Year | Tax Paid | Tax Assessment Tax Assessment Total Assessment is a certain percentage of the fair market value that is determined by local assessors to be the total taxable value of land and additions on the property. | Land | Improvement |
|---|---|---|---|---|
| 2025 | $5,177 | $368,810 | $101,235 | $267,575 |
| 2024 | $5,177 | $361,579 | $99,250 | $262,329 |
| 2023 | $5,033 | $354,490 | $97,304 | $257,186 |
| 2022 | $4,617 | $347,541 | $95,397 | $252,144 |
| 2021 | $4,808 | $340,727 | $93,527 | $247,200 |
| 2020 | $4,688 | $337,234 | $92,568 | $244,666 |
| 2019 | $4,472 | $330,622 | $90,753 | $239,869 |
| 2018 | $4,547 | $324,140 | $88,974 | $235,166 |
| 2017 | $4,372 | $317,785 | $87,230 | $230,555 |
| 2016 | $4,343 | $311,555 | $85,520 | $226,035 |
| 2015 | $4,305 | $306,876 | $84,236 | $222,640 |
| 2014 | $4,248 | $300,865 | $82,586 | $218,279 |
Source: Public Records
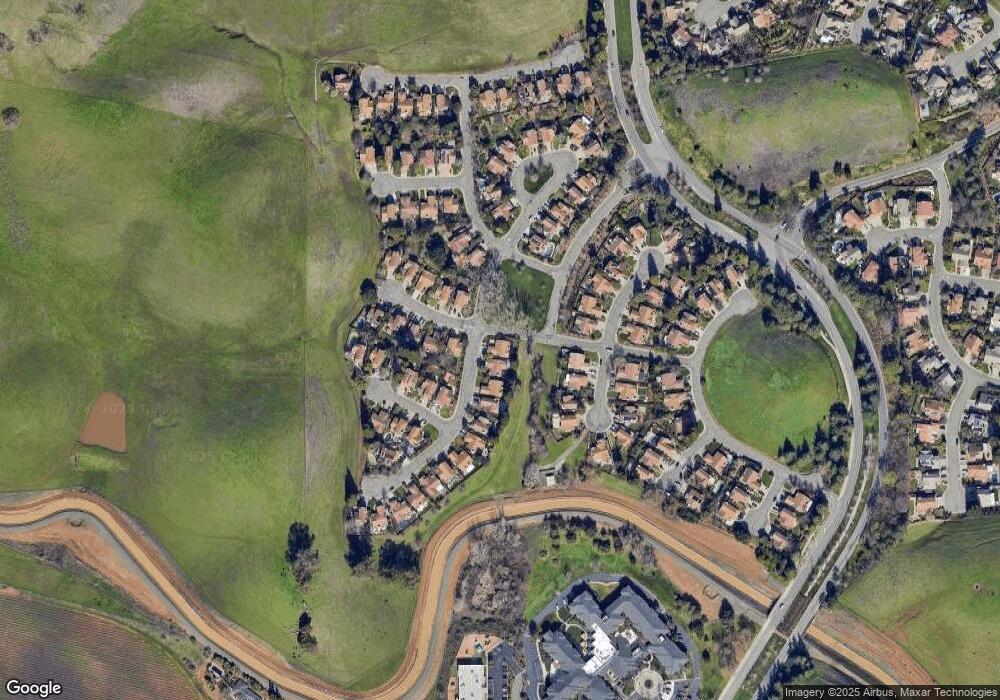
Map
Nearby Homes
- 3327 Colonial Ct Unit 1
- 2400 Merion Ct
- 3270 Formby Ln
- 3183 Olympic Rd
- 2125 Mecca Ct
- 3127 Olympic Rd
- 3114 Lomita Ct
- 3227 Balmoral Ct
- 3511 Norwalk Place
- 3369 Pebble Beach Ct
- 4683 Abernathy Rd
- 3259 Congressional Cir
- 2901 Pebble Beach Cir Unit 5
- 3456 Norwalk Place
- 3266 Congressional Cir
- 3261 Congressional Cir
- 4589 Abernathy Rd
- 2837 Watson Ct
- 3451 Nantucket Dr
- 185 Canby Way
- 2446 Bay Hill Dr
- 2442 Bay Hill Dr
- 3303 Colonial Ct
- 3304 Colonial Ct
- 2438 Bay Hill Dr
- 3309 Colonial Ct
- 3300 Butler Ct
- 3310 Colonial Ct
- 3306 Butler Ct
- 2434 Bay Hill Dr
- 2429 Shawnee Ct
- 2423 Shawnee Ct
- 3315 Colonial Ct
- 2455 Whitemarsh Dr Unit 1
- 2441 Sawgrass Ct
- 2417 Shawnee Ct
- 3308 Butler Ct
- 3316 Colonial Ct
- 2443 Sawgrass Ct
- 2411 Shawnee Ct
Your Personal Tour Guide
Ask me questions while you tour the home.