Estimated Value: $182,000 - $254,000
2
Beds
1
Bath
864
Sq Ft
$256/Sq Ft
Est. Value
About This Home
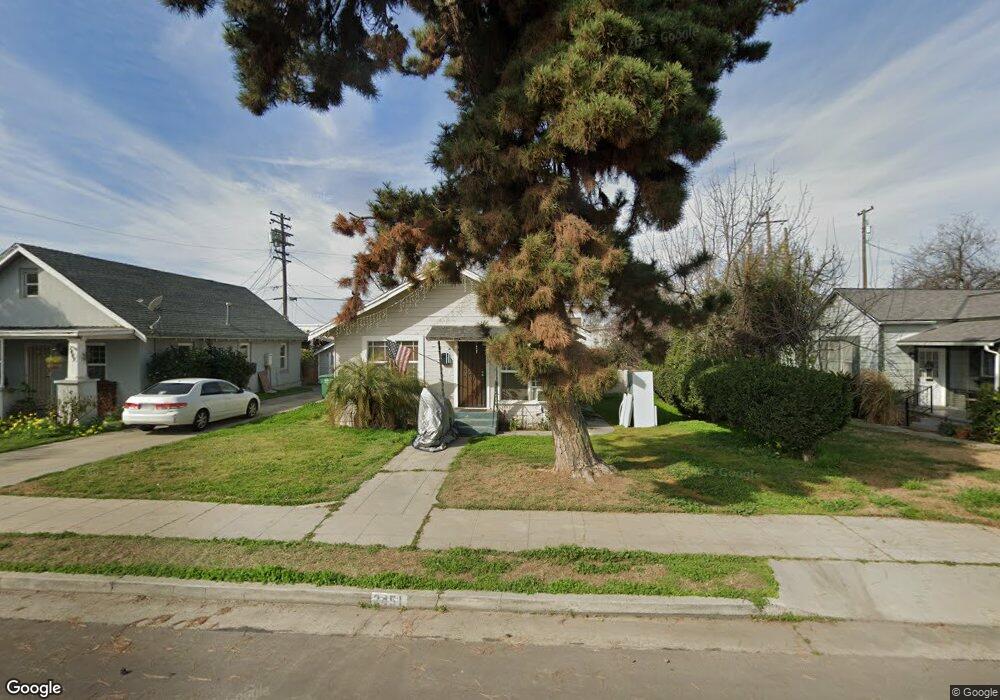
This home is located at 2451 B St, Selma, CA 93662 and is currently estimated at $220,779, approximately $255 per square foot. 2451 B St is a home located in Fresno County with nearby schools including James Garfield Elementary School, Abraham Lincoln Middle School, and Selma High School.
Ownership History
Date
Name
Owned For
Owner Type
Purchase Details
Closed on
Jan 27, 2022
Sold by
Grote Mary Helen
Bought by
Grote Mary Helen and Meza John
Current Estimated Value
Home Financials for this Owner
Home Financials are based on the most recent Mortgage that was taken out on this home.
Original Mortgage
$60,250
Outstanding Balance
$55,879
Interest Rate
3.45%
Mortgage Type
New Conventional
Estimated Equity
$164,900
Purchase Details
Closed on
Mar 14, 2005
Sold by
Meza John
Bought by
Grote Mary Helen
Purchase Details
Closed on
Dec 29, 2004
Sold by
Swanson Norman Lee
Bought by
Grote Mary Helen
Home Financials for this Owner
Home Financials are based on the most recent Mortgage that was taken out on this home.
Original Mortgage
$63,600
Interest Rate
7.12%
Mortgage Type
Purchase Money Mortgage
Create a Home Valuation Report for This Property
The Home Valuation Report is an in-depth analysis detailing your home's value as well as a comparison with similar homes in the area
Home Values in the Area
Average Home Value in this Area
Purchase History
| Date | Buyer | Sale Price | Title Company |
|---|---|---|---|
| Grote Mary Helen | -- | Mortgage Connect | |
| Grote Mary Helen | -- | Financial Title Company | |
| Grote Mary Helen | $79,500 | Financial Title Company |
Source: Public Records
Mortgage History
| Date | Status | Borrower | Loan Amount |
|---|---|---|---|
| Open | Grote Mary Helen | $60,250 | |
| Previous Owner | Grote Mary Helen | $63,600 | |
| Closed | Grote Mary Helen | $15,900 |
Source: Public Records
Tax History
| Year | Tax Paid | Tax Assessment Tax Assessment Total Assessment is a certain percentage of the fair market value that is determined by local assessors to be the total taxable value of land and additions on the property. | Land | Improvement |
|---|---|---|---|---|
| 2025 | $2,418 | $125,435 | $48,778 | $76,657 |
| 2023 | $1,892 | $120,566 | $46,885 | $73,681 |
| 2022 | $2,222 | $118,203 | $45,966 | $72,237 |
| 2021 | $2,163 | $115,886 | $45,065 | $70,821 |
| 2020 | $2,133 | $114,698 | $44,603 | $70,095 |
| 2019 | $1,867 | $95,000 | $40,000 | $55,000 |
| 2018 | $1,686 | $81,600 | $40,800 | $40,800 |
| 2017 | $1,610 | $80,000 | $40,000 | $40,000 |
| 2016 | $1,427 | $75,000 | $30,000 | $45,000 |
| 2015 | $1,352 | $65,900 | $25,500 | $40,400 |
| 2014 | $1,273 | $61,800 | $23,900 | $37,900 |
Source: Public Records
Map
Nearby Homes
- 2406 B St
- 0 Rose Ave
- 2629 Mccall Ave
- 1517 Stillman St
- 2002 Merced St
- 12623 S Mccall Ave
- 2226 Arrants St
- 2841 C St
- 2850 Mccall Ave Unit A-F
- 2482 Country Club Ln
- 2232 Gaither St
- 1233 Redwood Ln
- 1361 Almond St
- 2772 Valley View St
- 2221 Floral Ave
- 2022 Bauder St
- 2980 Olive St
- 2019 Oak St
- 2591 Rose Ave
- 2546 Evergreen St
Your Personal Tour Guide
Ask me questions while you tour the home.