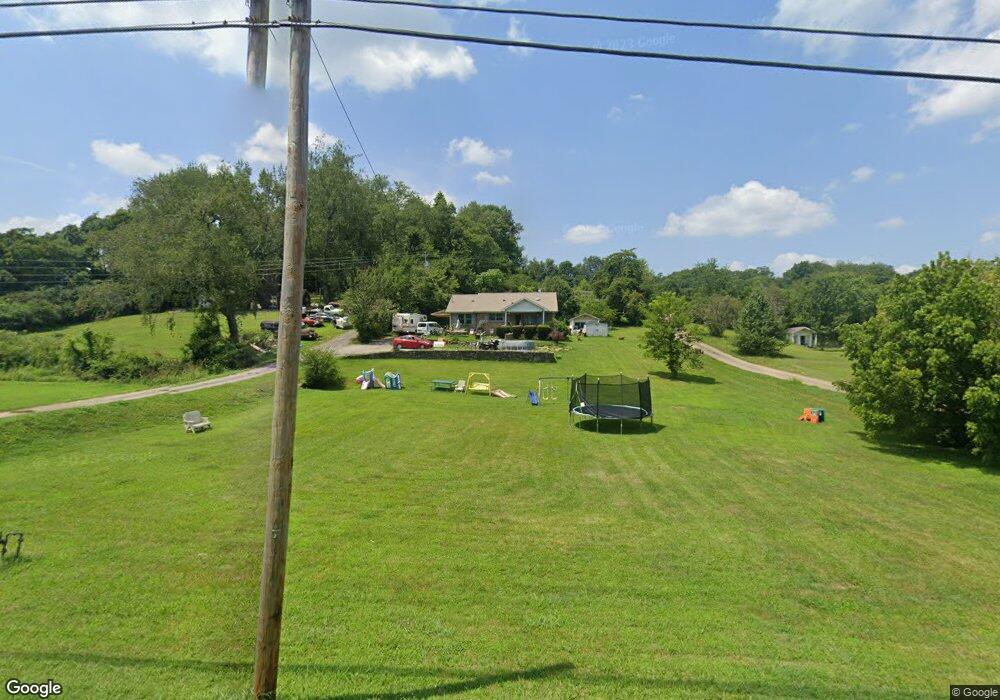
2453 Columbia Hwy Pulaski, TN 38478
Estimated Value: $165,000 - $260,000
--
Bed
--
Bath
1,472
Sq Ft
$138/Sq Ft
Est. Value
About This Home
This home is located at 2453 Columbia Hwy, Pulaski, TN 38478 and is currently estimated at $203,330, approximately $138 per square foot. 2453 Columbia Hwy is a home with nearby schools including Pulaski Elementary School, Southside Elementary School, and Bridgeforth Middle School.
Ownership History
Date
Name
Owned For
Owner Type
Purchase Details
Closed on
Aug 24, 2021
Sold by
Summers Sonney L
Bought by
Harris Harold Jay and Westcott Robin
Current Estimated Value
Home Financials for this Owner
Home Financials are based on the most recent Mortgage that was taken out on this home.
Original Mortgage
$122,729
Outstanding Balance
$23,804
Interest Rate
2.8%
Mortgage Type
Commercial
Estimated Equity
$179,526
Purchase Details
Closed on
May 11, 2018
Sold by
Metropolitan Life Insurance Company
Bought by
Westcott Robin
Purchase Details
Closed on
Apr 27, 2017
Sold by
Letourneau Jean L
Bought by
Metropolititan Life Insurance Co
Purchase Details
Closed on
Mar 28, 2016
Sold by
Letourneau Jean L
Bought by
Summers Christine L
Purchase Details
Closed on
Jan 14, 1997
Sold by
Mccracken Ruth N
Bought by
Higgins Ronald and Higgins Jean
Purchase Details
Closed on
May 1, 1987
Bought by
Mccracken Ruth N
Purchase Details
Closed on
Jan 3, 1979
Create a Home Valuation Report for This Property
The Home Valuation Report is an in-depth analysis detailing your home's value as well as a comparison with similar homes in the area
Home Values in the Area
Average Home Value in this Area
Purchase History
| Date | Buyer | Sale Price | Title Company |
|---|---|---|---|
| Harris Harold Jay | $100,000 | First Commerce Title Co Llc | |
| Westcott Robin | $15,000 | Fidelity Land Title Agency | |
| Metropolititan Life Insurance Co | $30,000 | None Available | |
| Summers Christine L | $85,000 | -- | |
| Higgins Ronald | $50,000 | -- | |
| Mccracken Ruth N | -- | -- | |
| -- | -- | -- |
Source: Public Records
Mortgage History
| Date | Status | Borrower | Loan Amount |
|---|---|---|---|
| Open | Harris Harold Jay | $122,729 |
Source: Public Records
Tax History Compared to Growth
Tax History
| Year | Tax Paid | Tax Assessment Tax Assessment Total Assessment is a certain percentage of the fair market value that is determined by local assessors to be the total taxable value of land and additions on the property. | Land | Improvement |
|---|---|---|---|---|
| 2025 | $776 | $39,050 | $0 | $0 |
| 2024 | $776 | $39,050 | $8,625 | $30,425 |
| 2023 | $776 | $39,050 | $8,625 | $30,425 |
| 2022 | $703 | $35,375 | $8,625 | $26,750 |
| 2021 | $614 | $21,725 | $4,075 | $17,650 |
| 2020 | $614 | $21,725 | $4,075 | $17,650 |
| 2019 | $614 | $21,725 | $4,075 | $17,650 |
| 2018 | $614 | $21,725 | $4,075 | $17,650 |
| 2017 | $614 | $21,725 | $4,075 | $17,650 |
| 2016 | $636 | $21,400 | $2,725 | $18,675 |
| 2015 | $593 | $21,400 | $2,725 | $18,675 |
| 2014 | $593 | $21,397 | $0 | $0 |
Source: Public Records
Map
Nearby Homes
- 130 Rambling Ridge
- 5 Rambling Ridge Rd
- 20 View Point Valley
- 19 View Point Valley
- 18 View Point Valley
- 25 View Point Valley
- 124 Lookout Ln
- 1811 Columbia Hwy
- 340 Bailey Ln
- 0 N 3rd St
- 958 Dollar Hollow Rd
- 0 Industrial Loop Rd
- 215 Al Roman Rd
- 140 Phillips St
- 420 Fort Hill Dr
- 808 N 1st St
- 613 Mcgrew St
- 0 Sumpter St
- 118 Sunset Dr
- 720 W Madison St
- 2449 Columbia Hwy
- 2407 Columbia Hwy
- 2525 Columbia Hwy
- 2567 Columbia Hwy
- 2426 Columbia Hwy
- 31 Mountian View Dr
- 2334 Columbia Hwy
- 2605 Columbia Hwy
- 411 Mountain View Dr
- 2288 Columbia Hwy
- 0 Garland Dr
- 2705 Columbia Hwy
- 2262 Columbia Hwy
- 2670 Columbia Hwy
- 2706 Columbia Hwy
- 2706 Columbia Hwy
- 1000 Columbia Hwy
- 2709 Columbia Hwy
- 507 Mountain View Dr
- 0 Columbia Hwy Unit 1944421