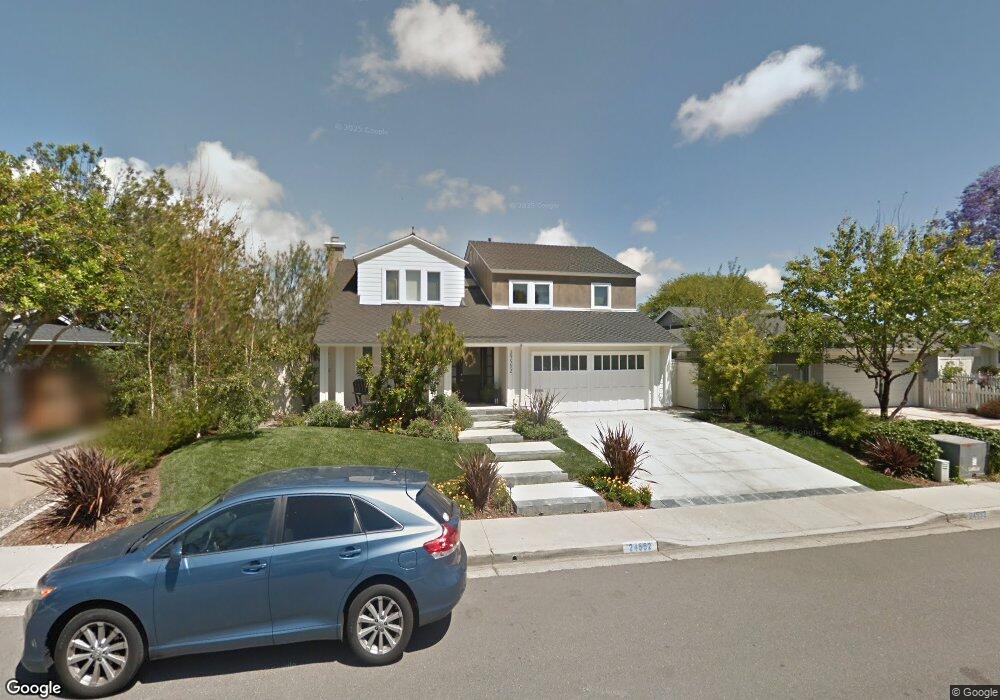
24552 Los Serranos Dr Laguna Niguel, CA 92677
Estimated Value: $1,933,000 - $2,357,000
4
Beds
3
Baths
2,400
Sq Ft
$888/Sq Ft
Est. Value
About This Home
This home is located at 24552 Los Serranos Dr, Laguna Niguel, CA 92677 and is currently estimated at $2,131,983, approximately $888 per square foot. 24552 Los Serranos Dr is a home located in Orange County with nearby schools including Hidden Hills Elementary, Niguel Hills Middle School, and Dana Hills High School.
Ownership History
Date
Name
Owned For
Owner Type
Purchase Details
Closed on
Nov 20, 2006
Sold by
Amsden Clifford N and Amsden Mary J
Bought by
Amsden Clifford N and Amsden Mary J
Current Estimated Value
Purchase Details
Closed on
Oct 28, 2004
Sold by
Garay Rosa M
Bought by
Amsden Clifford N and Amsden Mary J
Home Financials for this Owner
Home Financials are based on the most recent Mortgage that was taken out on this home.
Original Mortgage
$608,000
Outstanding Balance
$220,597
Interest Rate
1.75%
Mortgage Type
Negative Amortization
Estimated Equity
$1,911,386
Purchase Details
Closed on
Apr 19, 2001
Sold by
Cobb John M and Cobb Vicki L
Bought by
Garay Rosa M
Home Financials for this Owner
Home Financials are based on the most recent Mortgage that was taken out on this home.
Original Mortgage
$308,000
Interest Rate
7.14%
Create a Home Valuation Report for This Property
The Home Valuation Report is an in-depth analysis detailing your home's value as well as a comparison with similar homes in the area
Home Values in the Area
Average Home Value in this Area
Purchase History
| Date | Buyer | Sale Price | Title Company |
|---|---|---|---|
| Amsden Clifford N | -- | None Available | |
| Amsden Clifford N | $760,000 | California Title Company | |
| Garay Rosa M | $385,000 | First American Title Ins Co |
Source: Public Records
Mortgage History
| Date | Status | Borrower | Loan Amount |
|---|---|---|---|
| Open | Amsden Clifford N | $608,000 | |
| Previous Owner | Garay Rosa M | $308,000 | |
| Closed | Garay Rosa M | $37,000 |
Source: Public Records
Tax History Compared to Growth
Tax History
| Year | Tax Paid | Tax Assessment Tax Assessment Total Assessment is a certain percentage of the fair market value that is determined by local assessors to be the total taxable value of land and additions on the property. | Land | Improvement |
|---|---|---|---|---|
| 2025 | $15,401 | $1,558,182 | $920,450 | $637,732 |
| 2024 | $15,401 | $1,527,630 | $902,402 | $625,228 |
| 2023 | $15,074 | $1,497,677 | $884,708 | $612,969 |
| 2022 | $11,346 | $1,127,913 | $609,765 | $518,148 |
| 2021 | $11,126 | $1,105,798 | $597,809 | $507,989 |
| 2020 | $11,015 | $1,094,460 | $591,679 | $502,781 |
| 2019 | $10,796 | $1,073,000 | $580,077 | $492,923 |
| 2018 | $9,747 | $968,792 | $475,869 | $492,923 |
| 2017 | $9,747 | $968,792 | $475,869 | $492,923 |
| 2016 | $9,751 | $968,792 | $475,869 | $492,923 |
| 2015 | $9,604 | $954,240 | $468,721 | $485,519 |
| 2014 | $9,608 | $954,240 | $468,721 | $485,519 |
Source: Public Records
Map
Nearby Homes
- 24546 Los Serranos Dr
- 24556 Los Serranos Dr
- 24562 Los Serranos Dr
- 24542 Los Serranos Dr
- 24551 Los Serranos Dr
- 24545 Los Serranos Dr
- 24572 Los Serranos Dr
- 24532 Los Serranos Dr
- 24541 Los Serranos Dr
- 24531 Los Serranos Dr
- 24576 Los Serranos Dr
- 24571 Los Serranos Dr
- 24522 Los Serranos Dr
- 24521 Los Serranos Dr
- 30032 Bello Place
- 24582 Los Serranos Dr
- 24512 Los Serranos Dr
- 30022 Bello Place
- 24511 Los Serranos Dr
- 24592 Los Serranos Dr