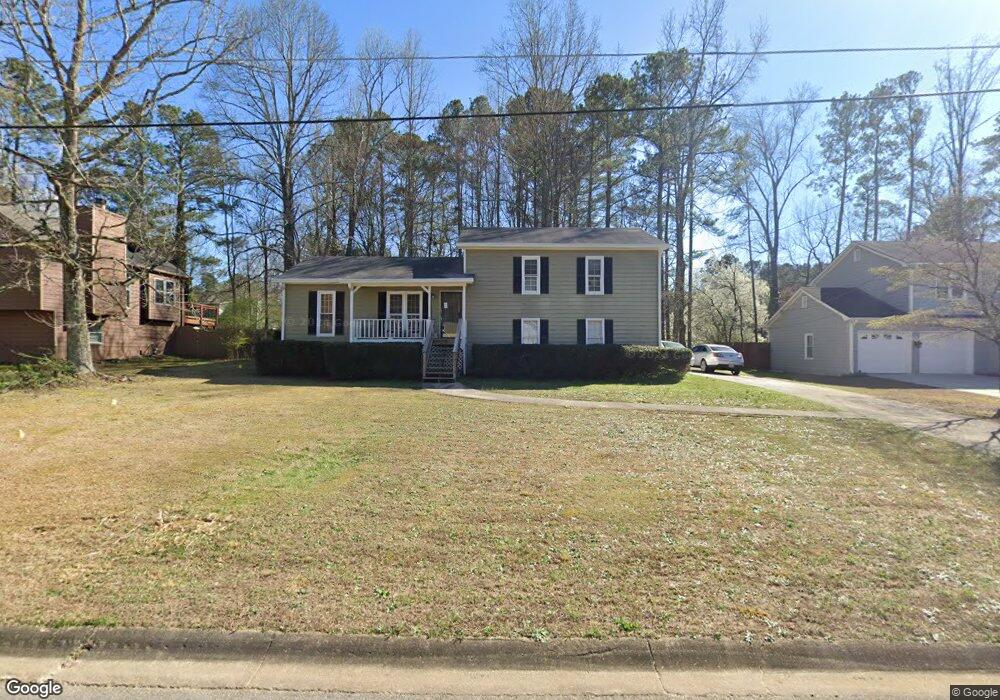
2459 Clintwood Dr SW Marietta, GA 30064
Estimated Value: $302,473 - $327,000
3
Beds
2
Baths
1,416
Sq Ft
$221/Sq Ft
Est. Value
About This Home
This home is located at 2459 Clintwood Dr SW, Marietta, GA 30064 and is currently estimated at $313,618, approximately $221 per square foot. 2459 Clintwood Dr SW is a home located in Cobb County with nearby schools including Dowell Elementary School, Smitha Middle School, and Osborne High School.
Ownership History
Date
Name
Owned For
Owner Type
Purchase Details
Closed on
Dec 26, 2012
Sold by
Barrere Richard H
Bought by
Barrere Richard H and Barrere Lydia M
Current Estimated Value
Home Financials for this Owner
Home Financials are based on the most recent Mortgage that was taken out on this home.
Original Mortgage
$129,472
Outstanding Balance
$91,292
Interest Rate
3.75%
Mortgage Type
FHA
Estimated Equity
$222,326
Purchase Details
Closed on
Oct 18, 2004
Sold by
Carman Robert L
Bought by
Barrere Richard H
Home Financials for this Owner
Home Financials are based on the most recent Mortgage that was taken out on this home.
Original Mortgage
$147,682
Interest Rate
5.73%
Mortgage Type
VA
Purchase Details
Closed on
May 31, 1995
Sold by
Horn Robert Sue
Bought by
Carman Robert
Create a Home Valuation Report for This Property
The Home Valuation Report is an in-depth analysis detailing your home's value as well as a comparison with similar homes in the area
Home Values in the Area
Average Home Value in this Area
Purchase History
| Date | Buyer | Sale Price | Title Company |
|---|---|---|---|
| Barrere Richard H | $150,000 | -- | |
| Barrere Richard H | $150,000 | -- | |
| Carman Robert | $90,900 | -- |
Source: Public Records
Mortgage History
| Date | Status | Borrower | Loan Amount |
|---|---|---|---|
| Open | Barrere Richard H | $129,472 | |
| Previous Owner | Barrere Richard H | $147,682 | |
| Closed | Carman Robert | $0 |
Source: Public Records
Tax History Compared to Growth
Tax History
| Year | Tax Paid | Tax Assessment Tax Assessment Total Assessment is a certain percentage of the fair market value that is determined by local assessors to be the total taxable value of land and additions on the property. | Land | Improvement |
|---|---|---|---|---|
| 2025 | $623 | $100,132 | $14,000 | $86,132 |
| 2024 | $625 | $100,132 | $14,000 | $86,132 |
| 2023 | $419 | $100,132 | $14,000 | $86,132 |
| 2022 | $570 | $81,576 | $14,000 | $67,576 |
| 2021 | $537 | $70,744 | $14,000 | $56,744 |
| 2020 | $508 | $60,972 | $14,000 | $46,972 |
| 2019 | $483 | $52,552 | $7,200 | $45,352 |
| 2018 | $483 | $52,552 | $7,200 | $45,352 |
| 2017 | $356 | $42,996 | $7,200 | $35,796 |
| 2016 | $357 | $42,996 | $7,200 | $35,796 |
| 2015 | $294 | $34,720 | $7,200 | $27,520 |
| 2014 | $217 | $27,064 | $0 | $0 |
Source: Public Records
Map
Nearby Homes
- 2415 Bankstone Dr SW
- 2166 Derbyshire Dr SW
- 2608 Foxwood Place SW Unit IV
- 2126 Green Dr SW
- 2284 Tree Arbor Way
- 2625 Deerfield Cir SW
- 2117 Caneridge Dr SW
- 2554 Red Barn Rd SW
- 2146 Caneridge Dr SW
- 2720 Cold Springs Trail SW
- 2450 Horseshoe Bend Rd SW
- 2409 Caneridge Point SW
- Bramblewood Plan at Oak Valley Estates
- Abney Plan at Oak Valley Estates
- Sherwood Plan at Oak Valley Estates
- Hedgerow Plan at Oak Valley Estates
- Presley Plan at Oak Valley Estates
- Chatfield Plan at Oak Valley Estates
- Dunning Plan at Oak Valley Estates
- 2723 Byess Ct
- 2461 Clintwood Dr SW Unit 2
- 2457 Clintwood Dr SW
- 2455 Clintwood Dr SW
- 2463 Clintwood Dr SW
- 2410 Shiloh Dr SW
- 2410 Shiloh Dr SW Unit 2410
- 2458 Clintwood Dr SW
- 2412 Shiloh Dr SW
- 2456 Clintwood Dr SW
- 2460 Clintwood Dr SW
- 2408 Shiloh Dr SW
- 2414 Shiloh Dr SW
- 2406 Shiloh Dr SW
- 2465 Clintwood Dr SW Unit II
- 2462 Clintwood Dr SW Unit 2
- 2453 Clintwood Dr SW
- 2454 Clintwood Dr SW Unit II
- 2404 Shiloh Dr SW
- 2464 Clintwood Dr SW Unit 2
- 2467 Clintwood Dr SW Unit 2