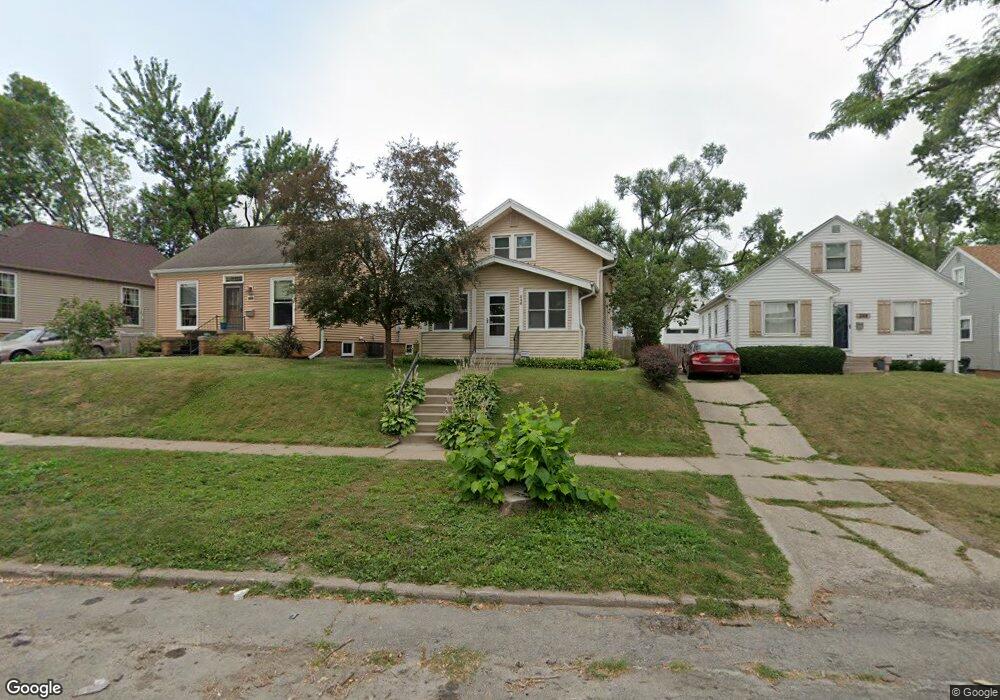
246 12th St NW Cedar Rapids, IA 52405
Northwest Area NeighborhoodEstimated Value: $141,000 - $164,000
3
Beds
2
Baths
1,459
Sq Ft
$106/Sq Ft
Est. Value
About This Home
This home is located at 246 12th St NW, Cedar Rapids, IA 52405 and is currently estimated at $154,297, approximately $105 per square foot. 246 12th St NW is a home located in Linn County with nearby schools including Junction City Elementary School, Harrison Elementary School, and Kentucky Tech - Ashland Reg Tech Center.
Ownership History
Date
Name
Owned For
Owner Type
Purchase Details
Closed on
May 31, 2011
Sold by
Stewart John W and Stewart Sharon K
Bought by
Stewart John W and Stewart Sharon K
Current Estimated Value
Create a Home Valuation Report for This Property
The Home Valuation Report is an in-depth analysis detailing your home's value as well as a comparison with similar homes in the area
Home Values in the Area
Average Home Value in this Area
Purchase History
| Date | Buyer | Sale Price | Title Company |
|---|---|---|---|
| Stewart John W | -- | None Available |
Source: Public Records
Tax History Compared to Growth
Tax History
| Year | Tax Paid | Tax Assessment Tax Assessment Total Assessment is a certain percentage of the fair market value that is determined by local assessors to be the total taxable value of land and additions on the property. | Land | Improvement |
|---|---|---|---|---|
| 2025 | $2,162 | $153,300 | $24,400 | $128,900 |
| 2024 | $2,562 | $134,900 | $24,400 | $110,500 |
| 2023 | $2,562 | $132,600 | $24,400 | $108,200 |
| 2022 | $2,286 | $130,300 | $22,400 | $107,900 |
| 2021 | $2,316 | $119,300 | $22,400 | $96,900 |
| 2020 | $2,316 | $113,600 | $18,300 | $95,300 |
| 2019 | $2,208 | $111,000 | $16,300 | $94,700 |
| 2018 | $2,052 | $111,000 | $16,300 | $94,700 |
| 2017 | $2,149 | $101,100 | $16,300 | $84,800 |
| 2016 | $2,149 | $101,100 | $16,300 | $84,800 |
| 2015 | $2,167 | $101,807 | $16,281 | $85,526 |
| 2014 | $2,158 | $101,807 | $16,281 | $85,526 |
| 2013 | $2,158 | $101,807 | $16,281 | $85,526 |
Source: Public Records
Map
Nearby Homes
- 1311 Burch Ave NW
- 217 11th St NW
- 1020 A Ave NW
- 263 Highland Dr NW
- 235 Highland Dr NW
- 290 Highland Dr NW
- 1118 2nd Ave SW
- 1400 7th Ave SW
- 1602 1st Ave NW
- 1025 3rd Ave SW
- 1649 B Ave NW
- 810 3rd Ave SW
- 1073 G Ave NW
- 720 E Ave NW
- 531 10th St SW
- 714 East Ave NW
- 819 G Ave NW
- 531 9th St SW
- 716 F Ave NW
- 816 9th St NW