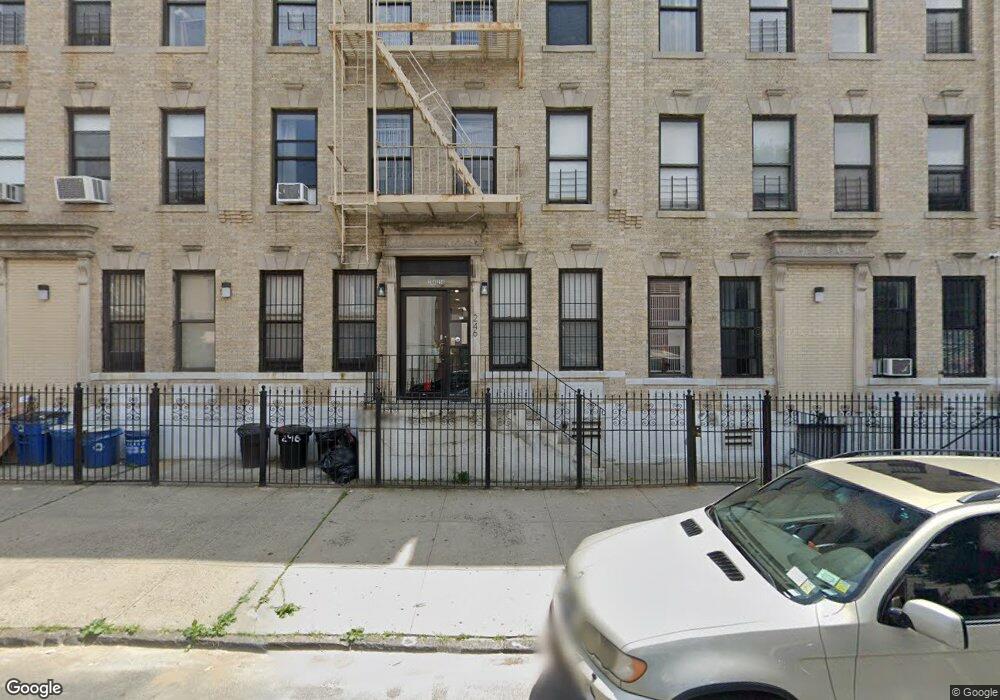
246 Sumpter St Unit 3B250 Brooklyn, NY 11233
Ocean Hill NeighborhoodEstimated Value: $573,000 - $718,000
--
Bed
--
Bath
990
Sq Ft
$673/Sq Ft
Est. Value
About This Home
This home is located at 246 Sumpter St Unit 3B250, Brooklyn, NY 11233 and is currently estimated at $666,515, approximately $673 per square foot. 246 Sumpter St Unit 3B250 is a home located in Kings County with nearby schools including P.S./I.S. 137 Rachel Jean Mitchell, P.S. Is 155 Nicholas Herkimer, and P.S. 178 Saint Clair Mckelway.
Ownership History
Date
Name
Owned For
Owner Type
Purchase Details
Closed on
Jan 26, 2018
Sold by
Arugula Llc
Bought by
Prat Brigitte L and Prat Lulu L
Current Estimated Value
Home Financials for this Owner
Home Financials are based on the most recent Mortgage that was taken out on this home.
Original Mortgage
$440,000
Outstanding Balance
$372,171
Interest Rate
3.94%
Mortgage Type
New Conventional
Estimated Equity
$294,344
Purchase Details
Closed on
Jun 23, 2015
Sold by
Cohen Sharon
Bought by
Arugula Llc
Purchase Details
Closed on
May 4, 2015
Sold by
Bourne Joy
Bought by
Cohen Sharon
Purchase Details
Closed on
Apr 16, 1997
Sold by
Ny/Enterprise Cityhome Housing Developme
Bought by
Bourne Joy
Home Financials for this Owner
Home Financials are based on the most recent Mortgage that was taken out on this home.
Original Mortgage
$32,259
Interest Rate
8.09%
Mortgage Type
Purchase Money Mortgage
Create a Home Valuation Report for This Property
The Home Valuation Report is an in-depth analysis detailing your home's value as well as a comparison with similar homes in the area
Home Values in the Area
Average Home Value in this Area
Purchase History
| Date | Buyer | Sale Price | Title Company |
|---|---|---|---|
| Prat Brigitte L | $550,000 | -- | |
| Prat Brigitte L | $550,000 | -- | |
| Arugula Llc | -- | -- | |
| Arugula Llc | -- | -- | |
| Cohen Sharon | $195,000 | -- | |
| Cohen Sharon | $195,000 | -- | |
| Bourne Joy | $67,500 | -- | |
| Bourne Joy | $67,500 | -- |
Source: Public Records
Mortgage History
| Date | Status | Borrower | Loan Amount |
|---|---|---|---|
| Open | Prat Brigitte L | $440,000 | |
| Closed | Prat Brigitte L | $440,000 | |
| Previous Owner | Bourne Joy | $32,259 |
Source: Public Records
Tax History Compared to Growth
Tax History
| Year | Tax Paid | Tax Assessment Tax Assessment Total Assessment is a certain percentage of the fair market value that is determined by local assessors to be the total taxable value of land and additions on the property. | Land | Improvement |
|---|---|---|---|---|
| 2025 | $5,404 | $54,778 | $7,230 | $47,548 |
| 2024 | $5,404 | $47,125 | $7,230 | $39,895 |
| 2023 | $3,863 | $45,041 | $7,230 | $37,811 |
| 2022 | $3,625 | $42,891 | $7,230 | $35,661 |
| 2021 | $3,341 | $37,876 | $7,230 | $30,646 |
| 2020 | $2,506 | $43,217 | $7,230 | $35,987 |
| 2019 | $4,492 | $41,491 | $7,230 | $34,261 |
| 2018 | $4,100 | $40,579 | $7,230 | $33,349 |
| 2017 | $3,671 | $35,075 | $7,230 | $27,845 |
| 2016 | $3,438 | $31,395 | $2,508 | $28,887 |
| 2015 | $797 | $29,539 | $2,508 | $27,031 |
| 2014 | $797 | $24,621 | $2,508 | $22,113 |
Source: Public Records
Map
Nearby Homes
- 246 Sumpter St Unit 1C
- 246-250 Sumpter St Unit 1C
- 242 Sumpter St
- 267 Sumpter St
- 369 Marion St Unit 2nd Floor
- 81 Hull St
- 446 Chauncey St Unit 4464
- 511 Chauncey St
- 231 Macdougal St
- 578 Bainbridge St
- 442 Marion St
- 596 Bainbridge St
- 364 Chauncey St
- 84 Macdougal St Unit 2
- 84 Macdougal St Unit 1
- 34 Rockaway Ave
- 495 Bainbridge St
- 1241 Herkimer St
- 479 Bainbridge St
- 479 Bainbridge St Unit Townhouse
- 246 Sumpter St Unit 3B
- 246 Sumpter St Unit 1B
- 246 Sumpter St Unit 3D250
- 246 Sumpter St Unit 3C250
- 246 Sumpter St Unit 3A250
- 246 Sumpter St Unit 2D250
- 246 Sumpter St Unit 2C250
- 246 Sumpter St Unit 2B250
- 246 Sumpter St Unit 2A250
- 246 Sumpter St Unit 1D250
- 246 Sumpter St Unit 1C250
- 246 Sumpter St Unit 1B250
- 246 Sumpter St Unit 1A250
- 246 Sumpter St Unit 250
- 246 Sumpter St Unit 3c
- 246 Sumpter St Unit 1A
- 246-250 Sumpter St Unit 3A
- 246-250 Sumpter St Unit 2B
- 246-250 Sumpter St Unit 2D
- 246-250 Sumpter St Unit 3B