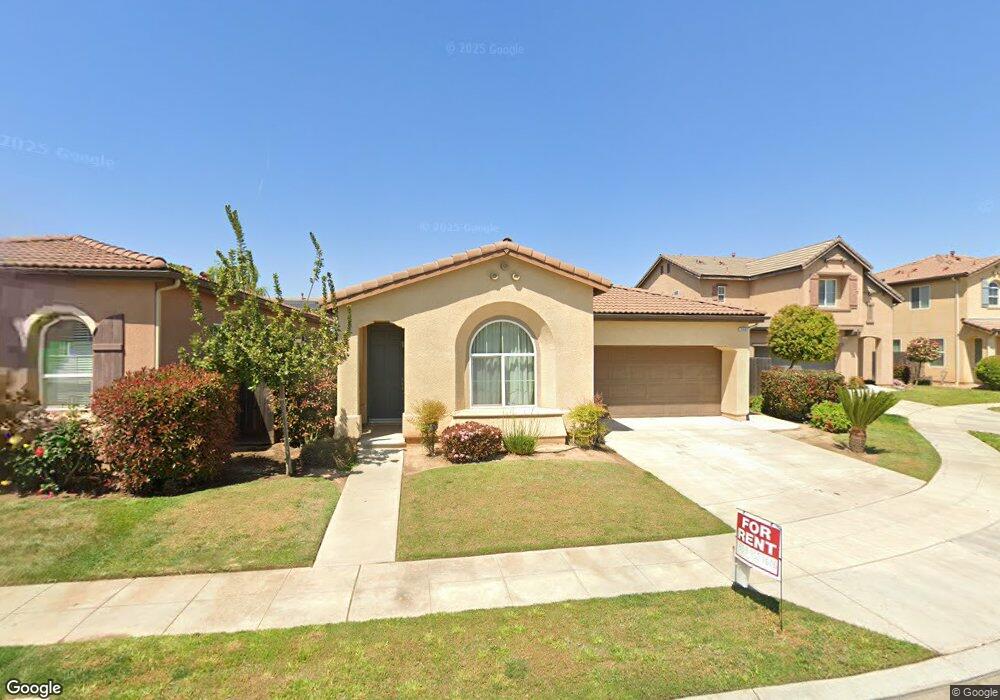
2462 E Turnberry Ave Fresno, CA 93730
Woodward Park NeighborhoodEstimated Value: $446,350 - $504,000
3
Beds
2
Baths
1,435
Sq Ft
$339/Sq Ft
Est. Value
About This Home
This home is located at 2462 E Turnberry Ave, Fresno, CA 93730 and is currently estimated at $487,088, approximately $339 per square foot. 2462 E Turnberry Ave is a home located in Fresno County with nearby schools including Copper Hills Elementary School, Granite Ridge Intermediate School, and Clovis North High School.
Ownership History
Date
Name
Owned For
Owner Type
Purchase Details
Closed on
Oct 13, 2020
Sold by
Young Chen Hua
Bought by
Young Chen Hua and Liang Kyminh
Current Estimated Value
Home Financials for this Owner
Home Financials are based on the most recent Mortgage that was taken out on this home.
Original Mortgage
$144,340
Outstanding Balance
$101,106
Interest Rate
2.9%
Mortgage Type
New Conventional
Estimated Equity
$385,982
Purchase Details
Closed on
Jul 18, 2011
Sold by
Liang Kyminh
Bought by
Young Chen Hua
Home Financials for this Owner
Home Financials are based on the most recent Mortgage that was taken out on this home.
Original Mortgage
$171,960
Interest Rate
4.45%
Mortgage Type
New Conventional
Purchase Details
Closed on
Jun 28, 2011
Sold by
Bn Hudson Ranch Lp
Bought by
Young Chen Hua
Home Financials for this Owner
Home Financials are based on the most recent Mortgage that was taken out on this home.
Original Mortgage
$171,960
Interest Rate
4.45%
Mortgage Type
New Conventional
Create a Home Valuation Report for This Property
The Home Valuation Report is an in-depth analysis detailing your home's value as well as a comparison with similar homes in the area
Home Values in the Area
Average Home Value in this Area
Purchase History
| Date | Buyer | Sale Price | Title Company |
|---|---|---|---|
| Young Chen Hua | -- | Old Republic Title | |
| Young Chen Hua | -- | First American Title Company | |
| Young Chen Hua | $215,000 | First American Title Company |
Source: Public Records
Mortgage History
| Date | Status | Borrower | Loan Amount |
|---|---|---|---|
| Open | Young Chen Hua | $144,340 | |
| Closed | Young Chen Hua | $171,960 |
Source: Public Records
Tax History Compared to Growth
Tax History
| Year | Tax Paid | Tax Assessment Tax Assessment Total Assessment is a certain percentage of the fair market value that is determined by local assessors to be the total taxable value of land and additions on the property. | Land | Improvement |
|---|---|---|---|---|
| 2025 | $3,488 | $269,913 | $119,318 | $150,595 |
| 2023 | $3,412 | $259,435 | $114,686 | $144,749 |
| 2022 | $3,228 | $254,349 | $112,438 | $141,911 |
| 2021 | $3,136 | $249,363 | $110,234 | $139,129 |
| 2020 | $3,112 | $246,807 | $109,104 | $137,703 |
| 2019 | $3,073 | $241,968 | $106,965 | $135,003 |
| 2018 | $2,983 | $237,224 | $104,868 | $132,356 |
| 2017 | $2,914 | $232,573 | $102,812 | $129,761 |
| 2016 | $2,815 | $228,014 | $100,797 | $127,217 |
| 2015 | $2,931 | $224,590 | $99,283 | $125,307 |
| 2014 | $2,714 | $220,192 | $97,339 | $122,853 |
Source: Public Records
Map
Nearby Homes
- 10612 N Dearing Ave
- 2537 E Prestwick Ave
- 10213 N Recreation Ave
- 2146 E Sawgrass Ave
- 2096 E Olympic Ave
- 2136 E Royal Dornoch Ave
- 2749 E Tamarind Dr
- 2789 E Tamarind Dr
- 2815 E Colina Dr
- 2827 E Colina Dr
- 0 E Behymer Ave
- 2445 E Copper Hill Way
- 10033 N Baird Ave
- 2037 Christensen Dr
- 2913 E Escarpa Dr
- 10551 N Jackson Ave
- 2020 Makenna Dr
- 10972 N Honeysuckle Dr
- 2322 E Revere Rd
- 10152 N Meridian Ave
- 2450 E Turnberry Ave
- 2474 E Turnberry Ave
- 2467 E Oakmont Ave
- 2486 E Turnberry Ave
- 2438 E Turnberry Ave
- 2455 E Oakmont Ave
- 2443 E Oakmont Ave
- 2469 E Turnberry Ave
- 2426 E Turnberry Ave
- 2481 E Turnberry Ave
- 2457 E Turnberry Ave
- 2431 E Oakmont Ave
- 10564 N Dearing Ave
- 2493 E Turnberry Ave
- 2445 E Turnberry Ave
- 2414 E Turnberry Ave
- 2433 E Turnberry Ave
- 2419 E Oakmont Ave
- 2450 E Oakmont Ave
- 10572 N Dearing Ave