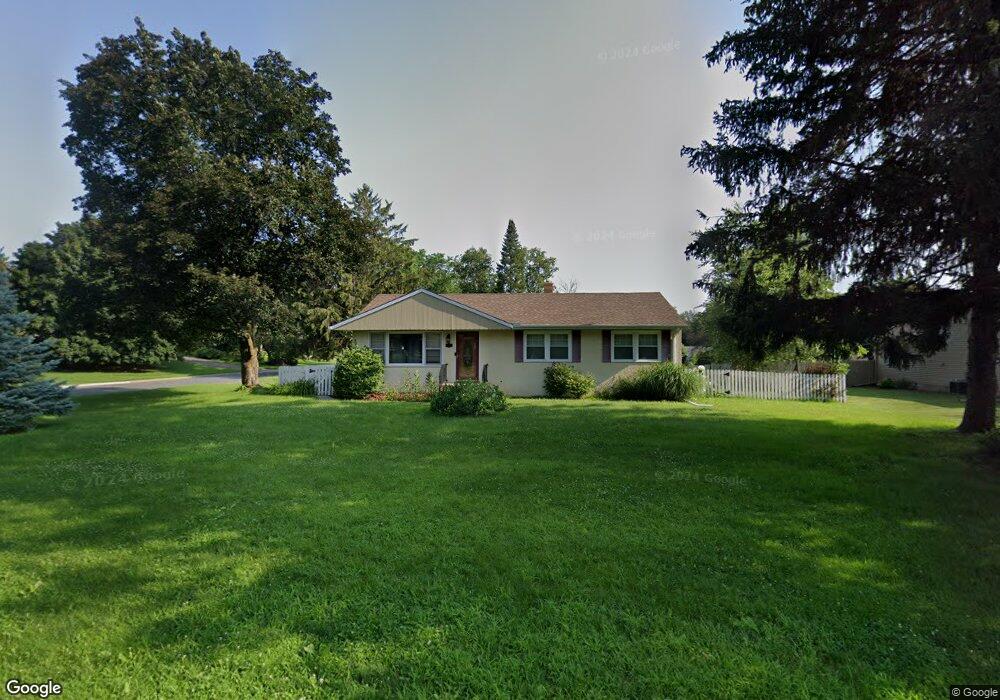
2465 Tierney Ave E Saint Paul, MN 55109
Estimated Value: $316,000 - $339,000
2
Beds
2
Baths
2,112
Sq Ft
$155/Sq Ft
Est. Value
About This Home
This home is located at 2465 Tierney Ave E, Saint Paul, MN 55109 and is currently estimated at $326,854, approximately $154 per square foot. 2465 Tierney Ave E is a home located in Ramsey County with nearby schools including John Glenn Middle School, North Metro Flex Middle School, and Lionsgate Academy AIM.
Ownership History
Date
Name
Owned For
Owner Type
Purchase Details
Closed on
Apr 26, 2019
Sold by
Hove Christopher James and Hove Stefanie Lynn
Bought by
Hovseth Darla
Current Estimated Value
Home Financials for this Owner
Home Financials are based on the most recent Mortgage that was taken out on this home.
Original Mortgage
$148,000
Outstanding Balance
$130,122
Interest Rate
4.2%
Mortgage Type
New Conventional
Estimated Equity
$196,732
Purchase Details
Closed on
Jul 25, 2013
Sold by
Beumer Cynthia L
Bought by
Hove Christopher James and Hove Stefanie Lynn
Home Financials for this Owner
Home Financials are based on the most recent Mortgage that was taken out on this home.
Original Mortgage
$172,078
Interest Rate
4.02%
Mortgage Type
New Conventional
Purchase Details
Closed on
May 25, 2001
Sold by
Dieveneu
Bought by
Beumer Cynthia L
Create a Home Valuation Report for This Property
The Home Valuation Report is an in-depth analysis detailing your home's value as well as a comparison with similar homes in the area
Home Values in the Area
Average Home Value in this Area
Purchase History
| Date | Buyer | Sale Price | Title Company |
|---|---|---|---|
| Hovseth Darla | $230,000 | Titlesmart Inc | |
| Hove Christopher James | $182,775 | Title Recording Services Inc | |
| Beumer Cynthia L | $149,500 | -- |
Source: Public Records
Mortgage History
| Date | Status | Borrower | Loan Amount |
|---|---|---|---|
| Open | Hovseth Darla | $148,000 | |
| Previous Owner | Hove Christopher James | $172,078 |
Source: Public Records
Tax History
| Year | Tax Paid | Tax Assessment Tax Assessment Total Assessment is a certain percentage of the fair market value that is determined by local assessors to be the total taxable value of land and additions on the property. | Land | Improvement |
|---|---|---|---|---|
| 2025 | $3,994 | $315,200 | $68,600 | $246,600 |
| 2023 | $3,994 | $289,200 | $68,600 | $220,600 |
| 2022 | $3,508 | $277,700 | $68,600 | $209,100 |
| 2021 | $3,330 | $244,200 | $68,600 | $175,600 |
| 2020 | $3,342 | $235,400 | $68,600 | $166,800 |
| 2019 | $3,190 | $222,800 | $68,600 | $154,200 |
| 2018 | $2,954 | $213,200 | $68,600 | $144,600 |
| 2017 | $2,826 | $196,700 | $68,600 | $128,100 |
| 2016 | $2,812 | $0 | $0 | $0 |
| 2015 | $2,410 | $187,100 | $68,600 | $118,500 |
| 2014 | $2,062 | $0 | $0 | $0 |
Source: Public Records
Map
Nearby Homes
- 2079 3rd St N
- 2063 Parkway Dr
- 2354 Burke Ave E
- 2470 South Ave E
- 1603 Mary St N
- 2189 Gateway Hill Rd N
- 2278 Polar Way
- 2280 Polar Way
- 2231 N Penn Place Unit 322
- 2231 N Penn Place Unit 208
- 2231 N Penn Place Unit 114
- 2231 N Penn Place Unit 201
- 2231 N Penn Place Unit 209
- 2210 Gateway Curve N
- 3660 Gershwin Cir N
- 3677 Gershwin Ln N
- 2431 Tevlin Ct E
- 3637 Gershwin Ln N
- 2538 4th Ave E
- 3721 Gershwin Ln N
- 2465 2465 Tierney-Avenue-e
- 2465 2465 Tierney Ave E
- 2475 Tierney Ave E
- 2464 Holloway Ave E
- 2472 Holloway Ave E
- 1889 Mary Jo Ln
- 2485 Tierney Ave E
- 2472 2472 Holloway-Avenue-e
- 2480 Holloway Ave E
- 1899 Mary Jo Ln
- 1899 1899 Mary Jo-Lane-s
- 2466 Tierney Ave E
- 2476 Tierney Ave E
- 1879 Mary Jo Ln
- 2488 Holloway Ave E
- 1911 Mary Jo Ln
- 1911 1911 Mary Joe Ln
- 1911 1911 Mary Jo Ln
- 2493 Tierney Ave E
- 2492 Tierney Ave E
Your Personal Tour Guide
Ask me questions while you tour the home.