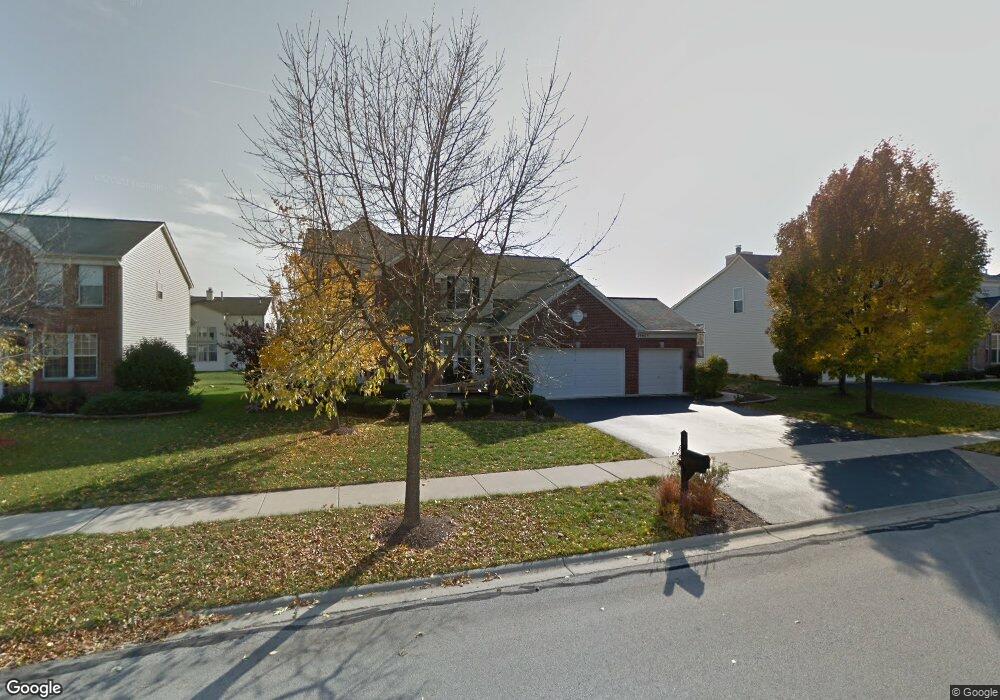
24665 Generation Dr Plainfield, IL 60585
North Plainfield NeighborhoodEstimated Value: $594,283 - $688,000
4
Beds
4
Baths
2,846
Sq Ft
$231/Sq Ft
Est. Value
About This Home
This home is located at 24665 Generation Dr, Plainfield, IL 60585 and is currently estimated at $657,321, approximately $230 per square foot. 24665 Generation Dr is a home located in Will County with nearby schools including Danielle-Joy Peterson Elementary School, Clifford Crone Middle School, and Neuqua Valley High School.
Ownership History
Date
Name
Owned For
Owner Type
Purchase Details
Closed on
May 18, 2010
Sold by
Schopler Michael and Schopler Joanne
Bought by
Kim Eunkee and Song Jin Eun
Current Estimated Value
Home Financials for this Owner
Home Financials are based on the most recent Mortgage that was taken out on this home.
Original Mortgage
$240,000
Outstanding Balance
$151,293
Interest Rate
3.87%
Mortgage Type
New Conventional
Estimated Equity
$506,028
Purchase Details
Closed on
Apr 12, 2002
Sold by
Pulte Homes
Bought by
Schopler Michael and Schopler Joanne
Home Financials for this Owner
Home Financials are based on the most recent Mortgage that was taken out on this home.
Original Mortgage
$277,700
Interest Rate
6.82%
Create a Home Valuation Report for This Property
The Home Valuation Report is an in-depth analysis detailing your home's value as well as a comparison with similar homes in the area
Home Values in the Area
Average Home Value in this Area
Purchase History
| Date | Buyer | Sale Price | Title Company |
|---|---|---|---|
| Kim Eunkee | $385,000 | First American Title Ins Co | |
| Schopler Michael | $330,000 | First American Title Ins |
Source: Public Records
Mortgage History
| Date | Status | Borrower | Loan Amount |
|---|---|---|---|
| Open | Kim Eunkee | $240,000 | |
| Previous Owner | Schopler Michael | $277,700 |
Source: Public Records
Tax History
| Year | Tax Paid | Tax Assessment Tax Assessment Total Assessment is a certain percentage of the fair market value that is determined by local assessors to be the total taxable value of land and additions on the property. | Land | Improvement |
|---|---|---|---|---|
| 2024 | $11,548 | $165,171 | $30,249 | $134,922 |
| 2023 | $11,548 | $145,911 | $26,722 | $119,189 |
| 2022 | $10,355 | $133,829 | $25,279 | $108,550 |
| 2021 | $9,872 | $127,456 | $24,075 | $103,381 |
| 2020 | $9,691 | $125,437 | $23,694 | $101,743 |
| 2019 | $9,510 | $121,902 | $23,026 | $98,876 |
| 2018 | $8,541 | $108,099 | $22,519 | $85,580 |
| 2017 | $8,409 | $105,309 | $21,938 | $83,371 |
| 2016 | $8,357 | $103,042 | $21,466 | $81,576 |
| 2015 | $8,348 | $99,078 | $20,640 | $78,438 |
| 2014 | $8,348 | $96,909 | $20,640 | $76,269 |
| 2013 | $8,348 | $96,909 | $20,640 | $76,269 |
Source: Public Records
Map
Nearby Homes
- 4012 Champion Rd
- 4023 Juneberry Rd
- 4128 Callery Rd
- 4031 Juneberry Rd Unit 1
- 11616 Century Cir
- 4304 Champion Rd
- 11640 Century Cir
- 5332 Cedar Dr
- 3712 Ryder Ct
- 11300 Highland Dr S
- 0 W 119th St
- 5020 Christa Ct
- 11724 Glenn Cir Unit 4D
- 3915 Royal Portrush Dr
- 4207 Carpenter Rd
- 11330 Highland Dr S
- 24924 Franklin Ln Unit 123
- 24944 Franklin Ln Unit 131
- 24329 Leski Ln Unit 1
- 24050 W Champion Dr
- 24657 Generation Dr Unit 1
- 24707 Generation Dr Unit 1
- 24664 Apollo Dr Unit 1
- 24656 Apollo Dr Unit 1
- 24649 Generation Dr Unit 1
- 24715 Generation Dr Unit 1
- 24706 Generation Dr
- 24648 Apollo Dr Unit 1
- 24714 Apollo Dr
- 24656 Generation Dr
- 24714 Generation Dr Unit 1
- 24641 Generation Dr
- 24723 Generation Dr Unit 1
- 24722 Generation Dr Unit 1
- 24722 Generation Dr
- 24648 Generation Dr
- 24640 Apollo Dr
- 24722 Apollo Dr
- 24707 Apollo Dr Unit 1
- 24657 Apollo Dr
Your Personal Tour Guide
Ask me questions while you tour the home.