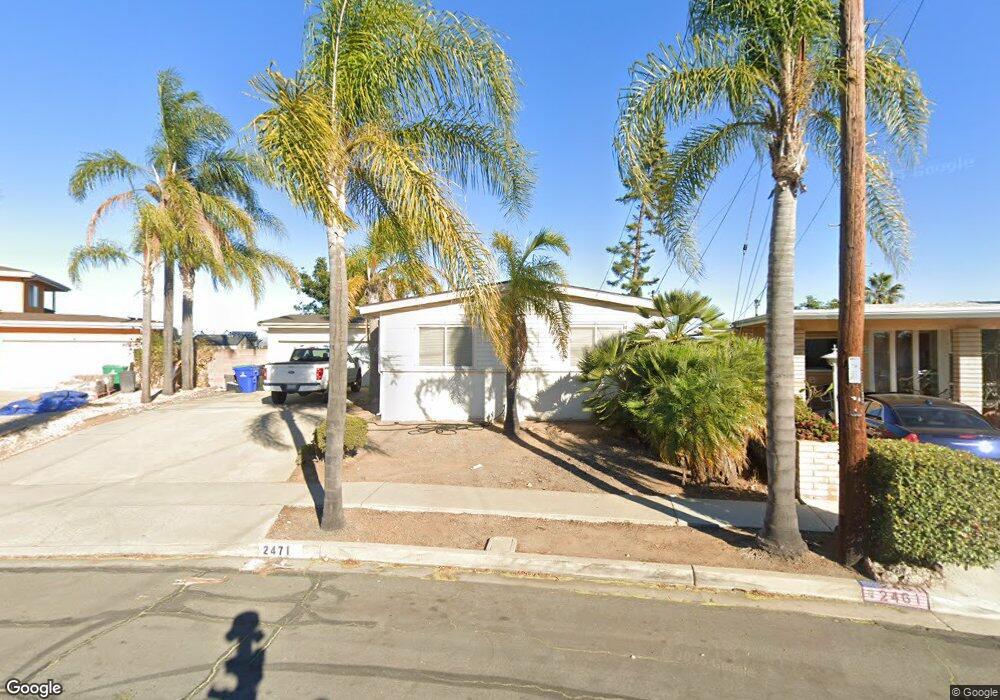
2471 Root St San Diego, CA 92123
Serra Mesa NeighborhoodEstimated Value: $969,197 - $1,252,000
4
Beds
2
Baths
1,380
Sq Ft
$769/Sq Ft
Est. Value
About This Home
This home is located at 2471 Root St, San Diego, CA 92123 and is currently estimated at $1,061,799, approximately $769 per square foot. 2471 Root St is a home located in San Diego County with nearby schools including Jones Elementary School, Taft Middle School, and Elevate Elementary School.
Ownership History
Date
Name
Owned For
Owner Type
Purchase Details
Closed on
Jun 15, 2006
Sold by
Quinones James P
Bought by
James Paul Quinones Separate Property Tr
Current Estimated Value
Purchase Details
Closed on
Aug 6, 2001
Sold by
Grauer Nancy Marie and Grauer Michael Ellis
Bought by
Quinones Maes P
Home Financials for this Owner
Home Financials are based on the most recent Mortgage that was taken out on this home.
Original Mortgage
$275,000
Interest Rate
7.05%
Purchase Details
Closed on
Jul 18, 2001
Sold by
Grauer Nancy Marie
Bought by
Grauer Michael Ellis and Grauer Nancy Marie
Home Financials for this Owner
Home Financials are based on the most recent Mortgage that was taken out on this home.
Original Mortgage
$275,000
Interest Rate
7.05%
Purchase Details
Closed on
Jun 9, 1994
Sold by
Grauer Ellis and Grauer Mary T
Bought by
Grauer Ellis and Grauer Mary T
Create a Home Valuation Report for This Property
The Home Valuation Report is an in-depth analysis detailing your home's value as well as a comparison with similar homes in the area
Home Values in the Area
Average Home Value in this Area
Purchase History
| Date | Buyer | Sale Price | Title Company |
|---|---|---|---|
| James Paul Quinones Separate Property Tr | -- | None Available | |
| Quinones Maes P | $307,000 | South Coast Title Company | |
| Grauer Michael Ellis | -- | -- | |
| Grauer Ellis | -- | -- |
Source: Public Records
Mortgage History
| Date | Status | Borrower | Loan Amount |
|---|---|---|---|
| Previous Owner | Quinones Maes P | $275,000 |
Source: Public Records
Tax History Compared to Growth
Tax History
| Year | Tax Paid | Tax Assessment Tax Assessment Total Assessment is a certain percentage of the fair market value that is determined by local assessors to be the total taxable value of land and additions on the property. | Land | Improvement |
|---|---|---|---|---|
| 2025 | $5,504 | $454,244 | $203,117 | $251,127 |
| 2024 | $5,504 | $445,338 | $199,135 | $246,203 |
| 2023 | $5,382 | $436,607 | $195,231 | $241,376 |
| 2022 | $5,239 | $428,047 | $191,403 | $236,644 |
| 2021 | $5,204 | $419,654 | $187,650 | $232,004 |
| 2020 | $5,141 | $415,352 | $185,726 | $229,626 |
| 2019 | $5,050 | $407,209 | $182,085 | $225,124 |
| 2018 | $4,722 | $399,225 | $178,515 | $220,710 |
| 2017 | $80 | $391,398 | $175,015 | $216,383 |
| 2016 | $4,536 | $383,725 | $171,584 | $212,141 |
| 2015 | $4,469 | $377,962 | $169,007 | $208,955 |
| 2014 | $4,399 | $370,559 | $165,697 | $204,862 |
Source: Public Records
Map
Nearby Homes
- 2421 Casement St
- 8874 Gowdy Ave
- 2673 Larkin Place
- 8627 Anrol Ave
- 2750 Walker Dr
- 9208 Piantino Way Unit 127
- 2816 Villas Way
- 2932 Villas Way
- 2706 Via Alta Place
- 2921 Via Alta Place
- 2753 Bellezza Dr
- 2641 Bellezza Dr
- 2770 Piantino Cir Unit 47
- 2772 Piantino Cir Unit 45
- 8441 Encino Ave
- 2756 Bellezza Dr
- 2642 Bellezza Dr
- 2524 Everly Ct
- E4 Plan at Everly at Civita
- E1X Plan at Everly at Civita
- 2461 Root St
- 2481 Root St
- 2451 Root St
- 8890 Raejean Ave
- 2470 Root St
- 2441 Root St
- 2452 Root St
- 8881 Raejean Ave
- 8880 Raejean Ave
- 2442 Root St
- 2431 Root St
- 8865 Raejean Ave
- 8870 Raejean Ave
- 8840 Greyling Place
- 2432 Root St
- 8853 Raejean Ave
- 2421 Root St
- 8860 Raejean Ave
- 8826 Greyling Place
- 8825 Greyling Place