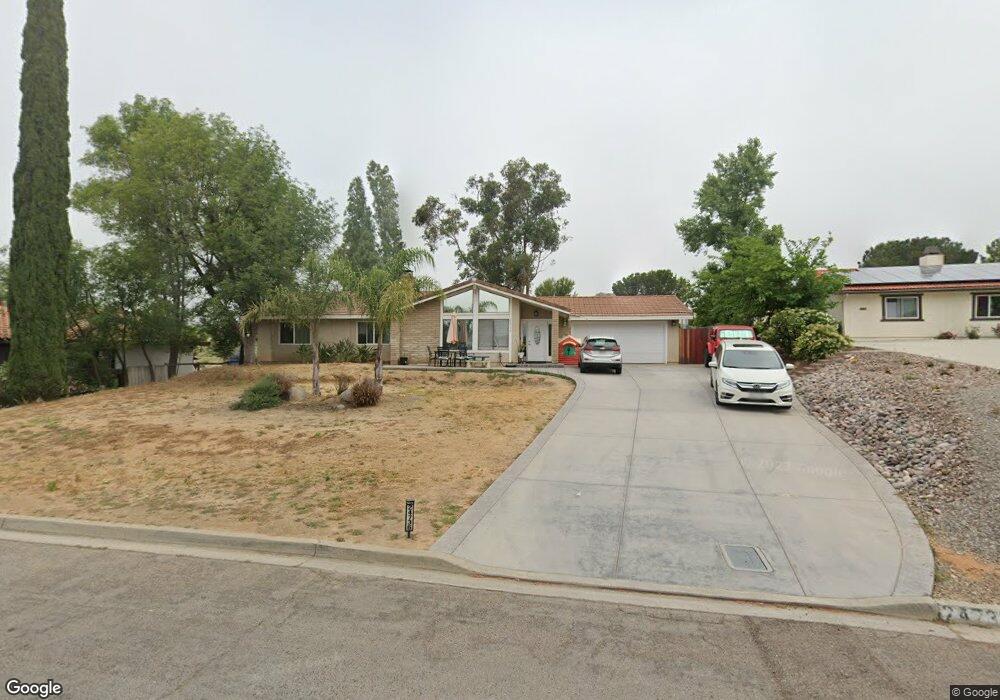
24736 Bjoin Rd Ramona, CA 92065
San Diego Country Estates NeighborhoodEstimated Value: $691,000 - $733,000
3
Beds
2
Baths
1,540
Sq Ft
$457/Sq Ft
Est. Value
About This Home
This home is located at 24736 Bjoin Rd, Ramona, CA 92065 and is currently estimated at $704,154, approximately $457 per square foot. 24736 Bjoin Rd is a home located in San Diego County with nearby schools including James Dukes Elementary School, Olive Peirce Middle School, and Ramona High School.
Ownership History
Date
Name
Owned For
Owner Type
Purchase Details
Closed on
May 3, 2023
Sold by
Stirling Scott M and Stirling Flordeliza G
Bought by
Stirling Family 2016 Living Trust
Current Estimated Value
Home Financials for this Owner
Home Financials are based on the most recent Mortgage that was taken out on this home.
Original Mortgage
$556,000
Interest Rate
6.32%
Mortgage Type
VA
Purchase Details
Closed on
Mar 27, 2023
Sold by
Stirling Family 2016 Living Trust
Bought by
Stirling Scott M and Stirling Flordeliza G
Home Financials for this Owner
Home Financials are based on the most recent Mortgage that was taken out on this home.
Original Mortgage
$556,000
Interest Rate
6.32%
Mortgage Type
VA
Purchase Details
Closed on
Sep 23, 2016
Sold by
Stirling Scott Mitchell and Stirling Flordeliza G
Bought by
Stirling Scott M and Stirling Flordeliza G
Home Financials for this Owner
Home Financials are based on the most recent Mortgage that was taken out on this home.
Original Mortgage
$428,000
Interest Rate
3.42%
Mortgage Type
VA
Purchase Details
Closed on
Aug 19, 2016
Sold by
Stirling Scott M and Stirling Flordeliza G
Bought by
Stirling Scott M and Stirling Flordeliza G
Home Financials for this Owner
Home Financials are based on the most recent Mortgage that was taken out on this home.
Original Mortgage
$428,000
Interest Rate
3.42%
Mortgage Type
VA
Purchase Details
Closed on
Aug 5, 2014
Sold by
Tunnell Scott T and Tunnell Tina N
Bought by
Stirling Scott Mitchell and Stirling Flordeliza G
Home Financials for this Owner
Home Financials are based on the most recent Mortgage that was taken out on this home.
Original Mortgage
$340,000
Interest Rate
4.11%
Mortgage Type
VA
Purchase Details
Closed on
Aug 10, 2005
Sold by
Baldwin Douglas and Baldwin Lauraine
Bought by
Tunnell Scott T and Tunnell Tina N
Home Financials for this Owner
Home Financials are based on the most recent Mortgage that was taken out on this home.
Original Mortgage
$434,900
Interest Rate
5.56%
Mortgage Type
Stand Alone Refi Refinance Of Original Loan
Purchase Details
Closed on
May 6, 2004
Sold by
Kissinger Dale W and Kissinger Barbara J
Bought by
Baldwin Douglas and Baldwin Lauraine
Home Financials for this Owner
Home Financials are based on the most recent Mortgage that was taken out on this home.
Original Mortgage
$383,200
Interest Rate
5.75%
Mortgage Type
Unknown
Purchase Details
Closed on
Mar 31, 1989
Purchase Details
Closed on
Feb 28, 1985
Create a Home Valuation Report for This Property
The Home Valuation Report is an in-depth analysis detailing your home's value as well as a comparison with similar homes in the area
Home Values in the Area
Average Home Value in this Area
Purchase History
| Date | Buyer | Sale Price | Title Company |
|---|---|---|---|
| Stirling Family 2016 Living Trust | -- | None Listed On Document | |
| Stirling Scott M | -- | Lawyers Title | |
| Stirling Scott M | -- | None Available | |
| Stirling Scott M | -- | Fidelity National Title Co | |
| Stirling Scott Mitchell | $340,000 | Fidelity National Title Co | |
| Tunnell Scott T | -- | Ticor Title Company | |
| Baldwin Douglas | $479,000 | Fidelity National Title | |
| -- | $159,900 | -- | |
| -- | $101,000 | -- |
Source: Public Records
Mortgage History
| Date | Status | Borrower | Loan Amount |
|---|---|---|---|
| Previous Owner | Stirling Scott M | $556,000 | |
| Previous Owner | Stirling Scott M | $428,000 | |
| Previous Owner | Stirling Scott Mitchell | $340,000 | |
| Previous Owner | Tunnell Scott T | $434,900 | |
| Previous Owner | Baldwin Douglas | $383,200 | |
| Closed | Baldwin Douglas | $95,800 |
Source: Public Records
Tax History
| Year | Tax Paid | Tax Assessment Tax Assessment Total Assessment is a certain percentage of the fair market value that is determined by local assessors to be the total taxable value of land and additions on the property. | Land | Improvement |
|---|---|---|---|---|
| 2025 | $5,435 | $408,618 | $150,952 | $257,666 |
| 2024 | $5,435 | $400,607 | $147,993 | $252,614 |
| 2023 | $3,267 | $385,053 | $142,248 | $242,805 |
| 2022 | $3,503 | $385,053 | $142,248 | $242,805 |
| 2021 | $3,457 | $377,504 | $139,459 | $238,045 |
| 2020 | $3,464 | $373,635 | $138,030 | $235,605 |
| 2019 | $3,404 | $366,310 | $135,324 | $230,986 |
| 2018 | $3,347 | $359,128 | $132,671 | $226,457 |
| 2017 | $3,312 | $352,087 | $130,070 | $222,017 |
| 2016 | $3,235 | $345,184 | $127,520 | $217,664 |
| 2015 | $3,338 | $340,000 | $125,605 | $214,395 |
| 2014 | $4,051 | $314,000 | $116,000 | $198,000 |
Source: Public Records
Map
Nearby Homes
- 24763 Leada Way
- 24726 Zanja Place
- 24849 Pappas Rd
- 24513 Tesoro Way
- 24719 Pappas Rd
- 25072 Poderio Dr
- 24638 Pappas Rd
- 24610 Pappas Rd
- 15810 Rainbird Rd
- 24131 Del Amo Rd
- 16134 Watt Way
- 15823 Davis Cup Ln
- 15828 Davis Cup Ln
- 24427 Del Amo Rd
- 000 Camino Arriba Unit 3
- 15721 Davis Cup Ln
- 15719 Davis Cup Ln
- 15710 Davis Cup Ln
- 15723 Davis Cup Ln
- 15755 Davis Cup Ln
- 24730 Bjoin Rd
- 24742 Bjoin Rd
- 24726 Bjoin Rd
- 24748 Bjoin Rd
- 24717 El Sebo Place
- 24722 Bjoin Rd
- 24731 Bjoin Rd
- 24747 Bjoin Rd
- 24723 Bjoin Rd
- 24713 El Sebo Place
- 24718 Bjoin Rd
- 16314 Daza Dr
- 16306 Daza Dr
- 16322 Daza Dr
- 24717 Bjoin Rd
- 16236 Daza Dr
- 16330 Daza Dr
- 24714 Bjoin Rd
- 24708 Bjoin Rd
- 24709 Bjoin Rd
Your Personal Tour Guide
Ask me questions while you tour the home.