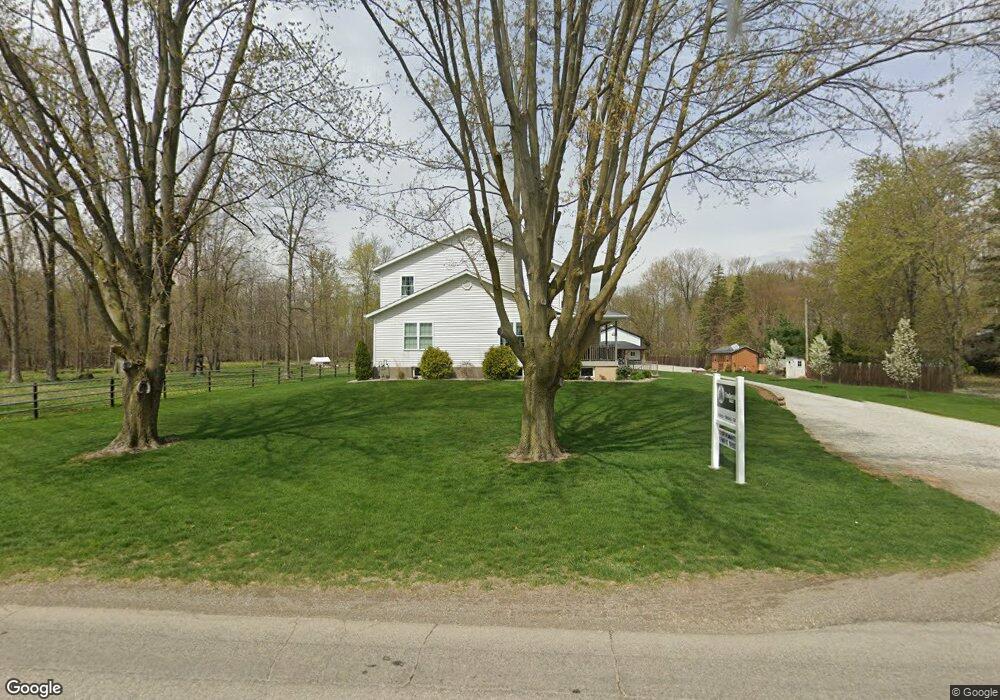
2475 W 700 S Topeka, IN 46571
Estimated Value: $233,000 - $761,000
3
Beds
2
Baths
3,770
Sq Ft
$150/Sq Ft
Est. Value
About This Home
This home is located at 2475 W 700 S, Topeka, IN 46571 and is currently estimated at $565,117, approximately $149 per square foot. 2475 W 700 S is a home located in LaGrange County with nearby schools including Topeka Elementary School, Westview Elementary School, and Westview Junior/Senior High School.
Ownership History
Date
Name
Owned For
Owner Type
Purchase Details
Closed on
Jun 10, 2021
Sold by
Bontrager Myron Jay
Bought by
Tri-County Land Trustee Corporation
Current Estimated Value
Home Financials for this Owner
Home Financials are based on the most recent Mortgage that was taken out on this home.
Interest Rate
2.96%
Purchase Details
Closed on
Mar 29, 2016
Sold by
Wilbur H Fry
Bought by
Myron Bontrager and Mary Jane Bontrager
Create a Home Valuation Report for This Property
The Home Valuation Report is an in-depth analysis detailing your home's value as well as a comparison with similar homes in the area
Home Values in the Area
Average Home Value in this Area
Purchase History
| Date | Buyer | Sale Price | Title Company |
|---|---|---|---|
| Tri-County Land Trustee Corporation | $375,000 | -- | |
| Myron Bontrager | $330,000 | Lakeland Title Company |
Source: Public Records
Mortgage History
| Date | Status | Borrower | Loan Amount |
|---|---|---|---|
| Closed | Tri-County Land Trustee Corporation | -- |
Source: Public Records
Tax History Compared to Growth
Tax History
| Year | Tax Paid | Tax Assessment Tax Assessment Total Assessment is a certain percentage of the fair market value that is determined by local assessors to be the total taxable value of land and additions on the property. | Land | Improvement |
|---|---|---|---|---|
| 2024 | $3,474 | $526,300 | $50,600 | $475,700 |
| 2023 | $3,068 | $500,300 | $43,200 | $457,100 |
| 2022 | $3,011 | $473,800 | $33,700 | $440,100 |
| 2021 | $2,744 | $410,900 | $32,000 | $378,900 |
| 2020 | $2,776 | $403,700 | $32,000 | $371,700 |
| 2019 | $2,652 | $393,300 | $32,000 | $361,300 |
| 2018 | $2,685 | $389,100 | $32,000 | $357,100 |
| 2017 | $2,015 | $331,600 | $32,000 | $299,600 |
| 2016 | $1,856 | $307,300 | $30,000 | $277,300 |
| 2014 | $1,641 | $270,600 | $27,800 | $242,800 |
| 2013 | $1,641 | $273,200 | $27,800 | $245,400 |
Source: Public Records
Map
Nearby Homes