2476 Stow St Simi Valley, CA 93063
East Simi Valley NeighborhoodEstimated Value: $752,593 - $891,000
3
Beds
2
Baths
1,976
Sq Ft
$411/Sq Ft
Est. Value
About This Home
This home is located at 2476 Stow St, Simi Valley, CA 93063 and is currently estimated at $811,898, approximately $410 per square foot. 2476 Stow St is a home located in Ventura County with nearby schools including Katherine Elementary School, Valley View Middle School, and Simi Valley High School.
Ownership History
Date
Name
Owned For
Owner Type
Purchase Details
Closed on
Sep 11, 2014
Sold by
Stewart Gayle E
Bought by
Stewart Gayle E
Current Estimated Value
Purchase Details
Closed on
Sep 18, 2001
Sold by
Papworth Shelly Mcbride
Bought by
Stewart Gayle E
Home Financials for this Owner
Home Financials are based on the most recent Mortgage that was taken out on this home.
Original Mortgage
$204,000
Outstanding Balance
$78,911
Interest Rate
6.88%
Estimated Equity
$732,987
Purchase Details
Closed on
Aug 12, 1997
Sold by
Papworth Michael James
Bought by
Papworth Shelly Mcbride
Home Financials for this Owner
Home Financials are based on the most recent Mortgage that was taken out on this home.
Original Mortgage
$126,400
Interest Rate
9.75%
Purchase Details
Closed on
Aug 1, 1997
Sold by
Swanson Ralph E and Swanson Linda B
Bought by
Papworth Shelly Mcbride
Home Financials for this Owner
Home Financials are based on the most recent Mortgage that was taken out on this home.
Original Mortgage
$126,400
Interest Rate
9.75%
Create a Home Valuation Report for This Property
The Home Valuation Report is an in-depth analysis detailing your home's value as well as a comparison with similar homes in the area
Home Values in the Area
Average Home Value in this Area
Purchase History
| Date | Buyer | Sale Price | Title Company |
|---|---|---|---|
| Stewart Gayle E | -- | None Available | |
| Stewart Gayle E | $255,000 | American Title Co | |
| Papworth Shelly Mcbride | -- | Chicago Title Co | |
| Papworth Shelly Mcbride | $158,000 | Chicago Title Co |
Source: Public Records
Mortgage History
| Date | Status | Borrower | Loan Amount |
|---|---|---|---|
| Open | Stewart Gayle E | $204,000 | |
| Previous Owner | Papworth Shelly Mcbride | $126,400 | |
| Closed | Papworth Shelly Mcbride | $15,800 |
Source: Public Records
Tax History Compared to Growth
Tax History
| Year | Tax Paid | Tax Assessment Tax Assessment Total Assessment is a certain percentage of the fair market value that is determined by local assessors to be the total taxable value of land and additions on the property. | Land | Improvement |
|---|---|---|---|---|
| 2025 | $4,752 | $376,686 | $150,674 | $226,012 |
| 2024 | $4,752 | $369,300 | $147,719 | $221,581 |
| 2023 | $4,465 | $362,059 | $144,822 | $217,237 |
| 2022 | $4,435 | $354,960 | $141,982 | $212,978 |
| 2021 | $4,392 | $348,000 | $139,198 | $208,802 |
| 2020 | $4,293 | $344,434 | $137,772 | $206,662 |
| 2019 | $4,095 | $337,681 | $135,071 | $202,610 |
| 2018 | $4,053 | $331,061 | $132,423 | $198,638 |
| 2017 | $3,957 | $324,571 | $129,827 | $194,744 |
| 2016 | $3,775 | $318,208 | $127,282 | $190,926 |
| 2015 | $3,690 | $313,430 | $125,371 | $188,059 |
| 2014 | $3,631 | $307,292 | $122,916 | $184,376 |
Source: Public Records
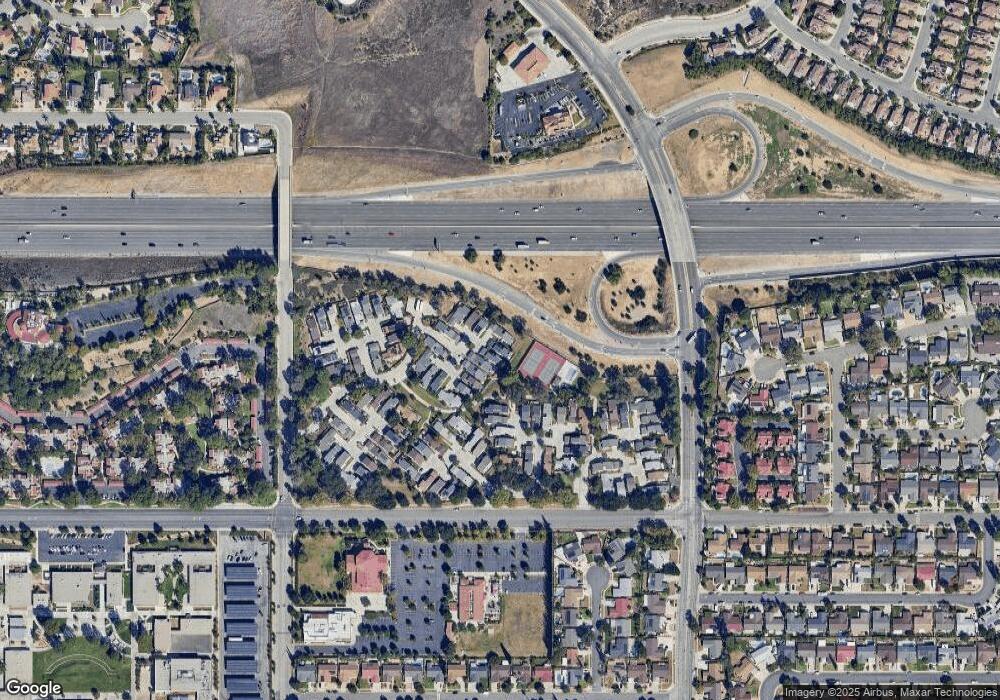
Map
Nearby Homes
- 2450 Stow St
- 2448 Stow St
- 2367 Saint Clair Ave
- 6004 Rothko Ln
- 2125 Yosemite Ave
- 2331 Welcome Ct
- 2352 Archwood Ln Unit 53
- 5621 Daisy St
- 6125 Grapevine Ct
- 2059 Tulip Ave
- 2040 Freesia Ave
- 2037 Freesia Ave
- 2024 Tulip Ave
- 5657 Pansy St
- 2375 Oak Haven Ave
- 5384 Rainwood St Unit 92
- 2026 Calle la Sombra Unit 2
- 2045 Avenida Refugio Unit 2
- 5368 Rainwood St Unit 65