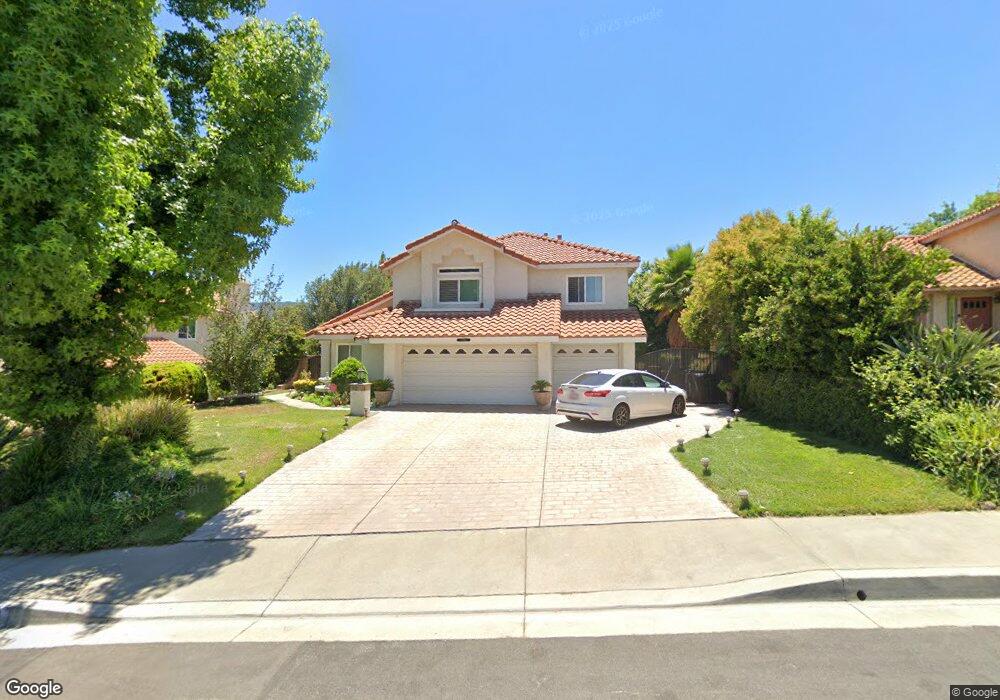
24768 Sagecrest Cir Stevenson Ranch, CA 91381
Estimated Value: $1,016,000 - $1,099,000
4
Beds
3
Baths
2,312
Sq Ft
$461/Sq Ft
Est. Value
About This Home
This home is located at 24768 Sagecrest Cir, Stevenson Ranch, CA 91381 and is currently estimated at $1,065,338, approximately $460 per square foot. 24768 Sagecrest Cir is a home located in Los Angeles County with nearby schools including Wiley Canyon Elementary School, Rancho Pico Junior High School, and West Ranch High School.
Ownership History
Date
Name
Owned For
Owner Type
Purchase Details
Closed on
Mar 30, 2004
Sold by
Deeb John P and Parco Marina L
Bought by
Deeb John P and Parco Deeb Marina
Current Estimated Value
Home Financials for this Owner
Home Financials are based on the most recent Mortgage that was taken out on this home.
Original Mortgage
$223,000
Outstanding Balance
$102,961
Interest Rate
5.39%
Mortgage Type
Purchase Money Mortgage
Estimated Equity
$962,377
Purchase Details
Closed on
Dec 1, 1995
Sold by
State Street Bank Na
Bought by
Deeb John P and Parco Marina L
Home Financials for this Owner
Home Financials are based on the most recent Mortgage that was taken out on this home.
Original Mortgage
$202,500
Interest Rate
7.47%
Purchase Details
Closed on
Apr 19, 1995
Sold by
Chaney Lonnie L and Chaney Chantra
Bought by
State Street Bank & Trust Company and Lehman Pass Through Securities Inc
Create a Home Valuation Report for This Property
The Home Valuation Report is an in-depth analysis detailing your home's value as well as a comparison with similar homes in the area
Home Values in the Area
Average Home Value in this Area
Purchase History
| Date | Buyer | Sale Price | Title Company |
|---|---|---|---|
| Deeb John P | -- | First American Title Co | |
| Deeb John P | $225,000 | Orange Coast Title | |
| State Street Bank & Trust Company | $240,000 | Chicago Title Company |
Source: Public Records
Mortgage History
| Date | Status | Borrower | Loan Amount |
|---|---|---|---|
| Open | Deeb John P | $223,000 | |
| Closed | Deeb John P | $202,500 |
Source: Public Records
Tax History Compared to Growth
Tax History
| Year | Tax Paid | Tax Assessment Tax Assessment Total Assessment is a certain percentage of the fair market value that is determined by local assessors to be the total taxable value of land and additions on the property. | Land | Improvement |
|---|---|---|---|---|
| 2025 | $6,783 | $428,538 | $142,688 | $285,850 |
| 2024 | $6,783 | $420,137 | $139,891 | $280,246 |
| 2023 | $6,513 | $411,900 | $137,149 | $274,751 |
| 2022 | $6,431 | $403,824 | $134,460 | $269,364 |
| 2021 | $6,335 | $395,907 | $131,824 | $264,083 |
| 2019 | $6,148 | $384,166 | $127,915 | $256,251 |
| 2018 | $6,023 | $376,634 | $125,407 | $251,227 |
| 2016 | $5,702 | $362,011 | $120,539 | $241,472 |
| 2015 | $5,604 | $356,574 | $118,729 | $237,845 |
| 2014 | $5,529 | $349,590 | $116,404 | $233,186 |
Source: Public Records
Map
Nearby Homes
- 0 Chicory Ct
- 25221 Summerhill Ln
- 25018 Smokewood Way
- 24389 La Glorita Cir
- 24305 Wabuska St
- 25225 Avenida Dorena Unit 10
- 25273 Avenida Dorena
- 24233 La Glorita Cir Unit 104
- 25260 Avenida Dorena
- 27120 Red Tail Place
- 27632 Ensemble Place
- 24115 Evans Ave Unit 1
- 27422 Pioneer Ct
- 27227 Coyote Bush Ct
- 26976 Prospector Rd Unit 201
- 24910 Old Stone Way
- 24845 Bella Vista Dr
- 25085 Highspring Ave
- 25510 Chisom Ln
- 24778 Masters Cup Way
- 24760 Sagecrest Cir
- 24772 Sagecrest Cir
- 24920 Chicory Ct
- 24752 Sagecrest Cir
- 24776 Sagecrest Cir
- 24914 Chicory Ct
- 24746 Sagecrest Cir
- 24771 Sagecrest Cir
- 24759 Sagecrest Cir
- 24775 Sagecrest Cir
- 24753 Sagecrest Cir
- 24738 Sagecrest Cir
- 24804 Sagecrest Cir
- 25003 Hollyhock Ct
- 24805 Sagecrest Cir
- 24925 Chicory Ct
- 24911 Chicory Ct
- 24732 Sagecrest Cir
- 25055 Hollyhock Ct
- 25059 Hollyhock Ct