Estimated Value: $208,148 - $285,000
4
Beds
1
Bath
1,479
Sq Ft
$159/Sq Ft
Est. Value
About This Home
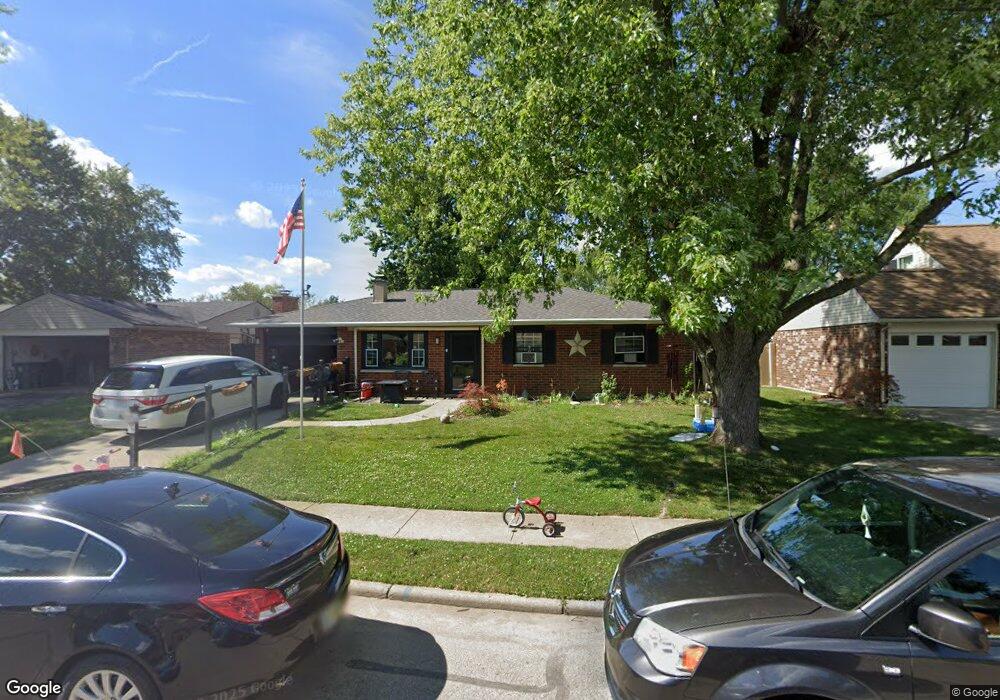
This home is located at 2479 Foxchase Ct E, Troy, OH 45373 and is currently estimated at $234,537, approximately $158 per square foot. 2479 Foxchase Ct E is a home located in Miami County with nearby schools including Hook Elementary School, Troy Junior High School, and Van Cleve Elementary School.
Ownership History
Date
Name
Owned For
Owner Type
Purchase Details
Closed on
Jan 31, 2017
Sold by
Murray Jo Anne
Bought by
Murray Benjamin Ic and Murray Fierra
Current Estimated Value
Home Financials for this Owner
Home Financials are based on the most recent Mortgage that was taken out on this home.
Original Mortgage
$99,460
Outstanding Balance
$80,341
Interest Rate
3.87%
Mortgage Type
FHA
Estimated Equity
$154,196
Purchase Details
Closed on
Dec 10, 2014
Sold by
Estate Of Anthony L Cooke
Bought by
Murray Jo Anne
Purchase Details
Closed on
Aug 26, 2002
Sold by
Murray Josephine A
Bought by
Cook Anthony L
Purchase Details
Closed on
Feb 10, 2000
Sold by
Cooke Anthony L
Bought by
Cooke Anthony L
Purchase Details
Closed on
Nov 26, 1990
Bought by
Cooke Anthony L
Create a Home Valuation Report for This Property
The Home Valuation Report is an in-depth analysis detailing your home's value as well as a comparison with similar homes in the area
Home Values in the Area
Average Home Value in this Area
Purchase History
| Date | Buyer | Sale Price | Title Company |
|---|---|---|---|
| Murray Benjamin Ic | $115,000 | None Available | |
| Murray Jo Anne | -- | None Available | |
| Cook Anthony L | -- | -- | |
| Cooke Anthony L | -- | -- | |
| Cooke Anthony L | $67,500 | -- |
Source: Public Records
Mortgage History
| Date | Status | Borrower | Loan Amount |
|---|---|---|---|
| Open | Murray Benjamin Ic | $99,460 |
Source: Public Records
Tax History
| Year | Tax Paid | Tax Assessment Tax Assessment Total Assessment is a certain percentage of the fair market value that is determined by local assessors to be the total taxable value of land and additions on the property. | Land | Improvement |
|---|---|---|---|---|
| 2025 | $1,983 | $56,390 | $9,140 | $47,250 |
| 2024 | $1,983 | $47,430 | $10,680 | $36,750 |
| 2023 | $1,827 | $47,430 | $10,680 | $36,750 |
| 2022 | $1,528 | $47,430 | $10,680 | $36,750 |
| 2021 | $1,149 | $33,880 | $7,630 | $26,250 |
| 2020 | $1,151 | $33,880 | $7,630 | $26,250 |
| 2019 | $1,161 | $33,880 | $7,630 | $26,250 |
| 2018 | $1,009 | $29,090 | $7,950 | $21,140 |
| 2017 | $1,020 | $29,090 | $7,950 | $21,140 |
| 2016 | $1,004 | $29,090 | $7,950 | $21,140 |
| 2015 | $1,008 | $27,970 | $7,630 | $20,340 |
| 2014 | $1,008 | $27,970 | $7,630 | $20,340 |
| 2013 | $1,014 | $27,970 | $7,630 | $20,340 |
Source: Public Records
Map
Nearby Homes
- 2472 Thornhill Dr
- 2508 Foxchase Ct W
- 2765 Liette Dr
- 2706 Executive Dr
- 541 Northpoint Ct
- 2659 Stonebridge
- 661 Willow Point Ct
- 835 Cobblestone Dr
- 2365 Murphy Ln W
- 640 Sedgwick Way
- 2391 Girard Ln W
- 673 Sedgwick Way
- 690 Rosecrest Dr
- 1463 Chelsea Rd
- 1137 Red Maple Dr
- 2273 Lytle Rd
- 2279 Lytle Rd
- 2311 Lytle Rd
- 1112 Red Maple Dr
- 2319 Lytle Rd
- 2477 Foxchase Ct E
- 2481 Foxchase Ct E
- 2482 Thornhill Dr
- 2475 Foxchase Ct E
- 2480 Thornhill Dr
- 2484 Thornhill Dr
- 2483 Foxchase Ct E
- 2482 Foxchase Ct E
- 2478 Thornhill Dr
- 2480 Foxchase Ct E
- 2486 Thornhill Dr
- 10 N Kings Chapel Dr
- 2484 Foxchase Ct E
- 2478 Foxchase Ct E
- 2485 Foxchase Ct E
- 2473 Foxchase Ct E
- 2486 Foxchase Ct E
- 2476 Thornhill Dr
- 2488 Thornhill Dr
- 2476 Foxchase Ct E
Your Personal Tour Guide
Ask me questions while you tour the home.