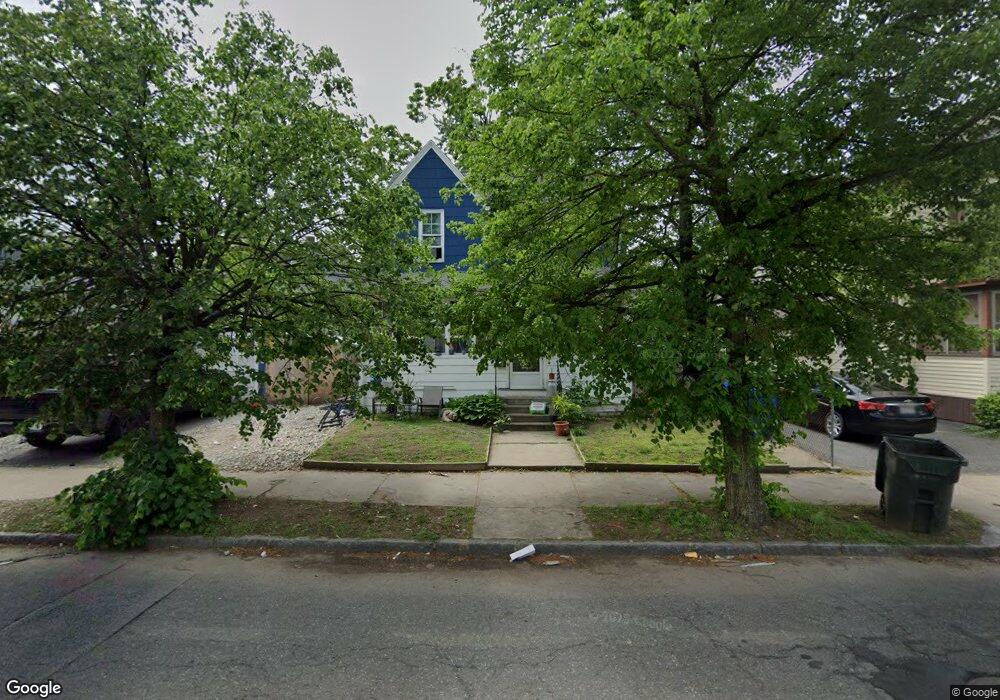
248 Allen St Springfield, MA 01108
Forest Park NeighborhoodEstimated Value: $242,000 - $259,000
3
Beds
1
Bath
1,288
Sq Ft
$197/Sq Ft
Est. Value
About This Home
This home is located at 248 Allen St, Springfield, MA 01108 and is currently estimated at $253,387, approximately $196 per square foot. 248 Allen St is a home located in Hampden County with nearby schools including White Street Elementary School, M Marcus Kiley Middle, and High School Of Commerce.
Ownership History
Date
Name
Owned For
Owner Type
Purchase Details
Closed on
Oct 9, 2020
Sold by
Scholtz Sharon L
Bought by
Scholtz John M and Reilly Andrea
Current Estimated Value
Purchase Details
Closed on
Aug 26, 2015
Sold by
Sarnelli Ronald J
Bought by
Scholtz Sharon L
Purchase Details
Closed on
Aug 13, 2015
Sold by
Harbour Portfolio 6 Lp
Bought by
Sarnelli Ronald J
Purchase Details
Closed on
Jan 28, 2011
Sold by
Fannie Mae
Bought by
Harbour Portfolio 6 Lp
Purchase Details
Closed on
May 20, 2010
Sold by
Jackson Alisa
Bought by
Federal National Mortgage Association
Purchase Details
Closed on
Oct 27, 2006
Sold by
Coughlin Edward J
Bought by
Jackson Alisa
Home Financials for this Owner
Home Financials are based on the most recent Mortgage that was taken out on this home.
Original Mortgage
$113,200
Interest Rate
6.48%
Mortgage Type
Purchase Money Mortgage
Create a Home Valuation Report for This Property
The Home Valuation Report is an in-depth analysis detailing your home's value as well as a comparison with similar homes in the area
Home Values in the Area
Average Home Value in this Area
Purchase History
| Date | Buyer | Sale Price | Title Company |
|---|---|---|---|
| Scholtz John M | -- | None Available | |
| Scholtz Sharon L | -- | -- | |
| Sarnelli Ronald J | $32,860 | -- | |
| Harbour Portfolio 6 Lp | $13,283 | -- | |
| Federal National Mortgage Association | $117,366 | -- | |
| Jackson Alisa | $113,200 | -- |
Source: Public Records
Mortgage History
| Date | Status | Borrower | Loan Amount |
|---|---|---|---|
| Previous Owner | Jackson Alisa | $113,200 |
Source: Public Records
Tax History
| Year | Tax Paid | Tax Assessment Tax Assessment Total Assessment is a certain percentage of the fair market value that is determined by local assessors to be the total taxable value of land and additions on the property. | Land | Improvement |
|---|---|---|---|---|
| 2025 | $3,326 | $212,100 | $29,300 | $182,800 |
| 2024 | $1,975 | $123,000 | $29,300 | $93,700 |
| 2023 | $2,177 | $127,700 | $26,700 | $101,000 |
| 2022 | $2,379 | $126,400 | $24,900 | $101,500 |
| 2021 | $2,217 | $117,300 | $22,600 | $94,700 |
| 2020 | $2,084 | $106,700 | $22,600 | $84,100 |
| 2019 | $2,023 | $102,800 | $22,600 | $80,200 |
| 2018 | $2,074 | $105,400 | $22,600 | $82,800 |
| 2017 | $1,954 | $99,400 | $21,200 | $78,200 |
| 2016 | $1,862 | $94,700 | $21,200 | $73,500 |
| 2015 | -- | $95,300 | $21,200 | $74,100 |
Source: Public Records
Map
Nearby Homes
- 244 Allen St
- 408 Orange St Unit 410
- 408-410 Orange St
- 406 Orange St
- 10 Properties
- 400 Orange St Unit 402
- 257 Allen St
- 262 Allen St
- 251 Allen St
- 267 Allen St
- 234 Allen St
- 396 Orange St
- 403 Orange St Unit 3R
- 403 Orange St Unit 1R
- 415 Orange St
- 407 Orange St
- 390 Orange St
- 281 Allen St
- 228 Allen St
- 228 Allen St Unit 228
Your Personal Tour Guide
Ask me questions while you tour the home.