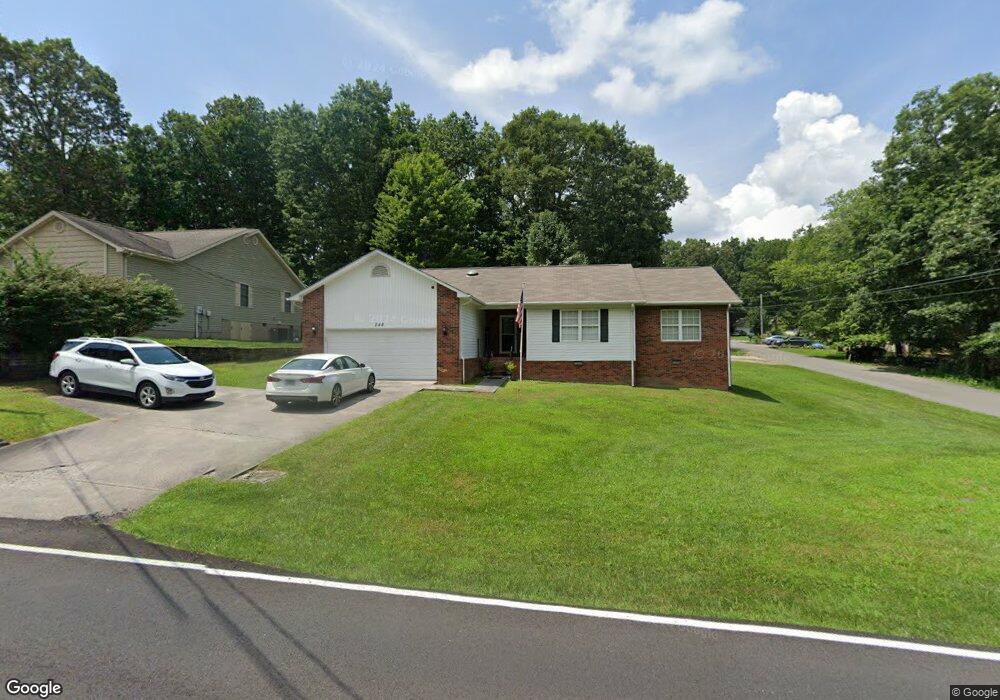
248 Spruce Loop Crossville, TN 38555
Estimated Value: $253,000 - $338,000
Studio
2
Baths
1,502
Sq Ft
$191/Sq Ft
Est. Value
About This Home
This home is located at 248 Spruce Loop, Crossville, TN 38555 and is currently estimated at $287,580, approximately $191 per square foot. 248 Spruce Loop is a home located in Cumberland County with nearby schools including Glenn Martin Elementary School, Cumberland County High School, and Christian Academy of the Cumberlands.
Ownership History
Date
Name
Owned For
Owner Type
Purchase Details
Closed on
May 26, 2021
Sold by
Hermeyer Gregory A and Hermeyer Susan L
Bought by
Lawson Jacob
Current Estimated Value
Home Financials for this Owner
Home Financials are based on the most recent Mortgage that was taken out on this home.
Original Mortgage
$181,500
Outstanding Balance
$165,608
Interest Rate
3%
Mortgage Type
USDA
Estimated Equity
$121,972
Purchase Details
Closed on
Jul 22, 2005
Sold by
Fickey Garry
Bought by
Hermeyer Gregory A
Home Financials for this Owner
Home Financials are based on the most recent Mortgage that was taken out on this home.
Original Mortgage
$133,777
Interest Rate
5.51%
Purchase Details
Closed on
Apr 7, 2003
Sold by
Leauber Marvin and Leauber Carolyn
Bought by
Fickey Garry and Fickey Darlene
Purchase Details
Closed on
Oct 21, 1997
Sold by
Stewart Dwight
Bought by
Leauber Marvin C
Purchase Details
Closed on
Mar 26, 1997
Sold by
Bone Johnnie L
Bought by
Stewart Dwight
Create a Home Valuation Report for This Property
The Home Valuation Report is an in-depth analysis detailing your home's value as well as a comparison with similar homes in the area
Purchase History
| Date | Buyer | Sale Price | Title Company |
|---|---|---|---|
| Lawson Jacob | $181,500 | None Available | |
| Lawson Jacob | $181,500 | Cantrell Christopher | |
| Hermeyer Gregory A | $134,900 | -- | |
| Fickey Garry | $107,900 | -- | |
| Leauber Marvin C | $90,000 | -- | |
| Stewart Dwight | $7,300 | -- |
Source: Public Records
Mortgage History
| Date | Status | Borrower | Loan Amount |
|---|---|---|---|
| Open | Lawson Jacob | $181,500 | |
| Closed | Lawson Jacob | $181,500 | |
| Previous Owner | Stewart Dwight | $133,777 |
Source: Public Records
Tax History
| Year | Tax Paid | Tax Assessment Tax Assessment Total Assessment is a certain percentage of the fair market value that is determined by local assessors to be the total taxable value of land and additions on the property. | Land | Improvement |
|---|---|---|---|---|
| 2025 | $532 | $46,875 | $3,750 | $43,125 |
| 2024 | $532 | $46,875 | $3,750 | $43,125 |
| 2023 | $532 | $46,875 | $0 | $0 |
| 2022 | $532 | $46,875 | $3,750 | $43,125 |
| 2021 | $452 | $28,875 | $3,375 | $25,500 |
| 2020 | $452 | $28,875 | $3,375 | $25,500 |
| 2019 | $452 | $28,875 | $3,375 | $25,500 |
| 2018 | $452 | $28,875 | $3,375 | $25,500 |
| 2017 | $452 | $28,875 | $3,375 | $25,500 |
| 2016 | $434 | $28,400 | $3,375 | $25,025 |
| 2015 | $425 | $28,400 | $3,375 | $25,025 |
| 2014 | $425 | $28,407 | $0 | $0 |
Source: Public Records
Map
Nearby Homes
- 1015 Myrtle Ave
- 112 Dove Dr
- 172 Sandpiper Loop
- 0 Satsuma Dr Unit RTC2774370
- 0 Satsuma Dr Unit RTC2774380
- 455 Carriage Dr
- 53 Carriage Dr
- Lot 1736 Satsuma Dr
- Lot 1735 Satsuma Dr
- 669 Myrtle Ave
- 573 Mockingbird Dr
- 803 Spruce Loop
- 490 Riverbend Dr Unit C4
- 484 River Bend Dr
- 484 River Bend Dr Unit c-5
- 0 Sweetgum Dr Unit 1257379
- 0 Riverbend Dr
- 41 Chelsea Dr
- 0 Narcissus St
- 63 Whitetail Run
Your Personal Tour Guide
Ask me questions while you tour the home.