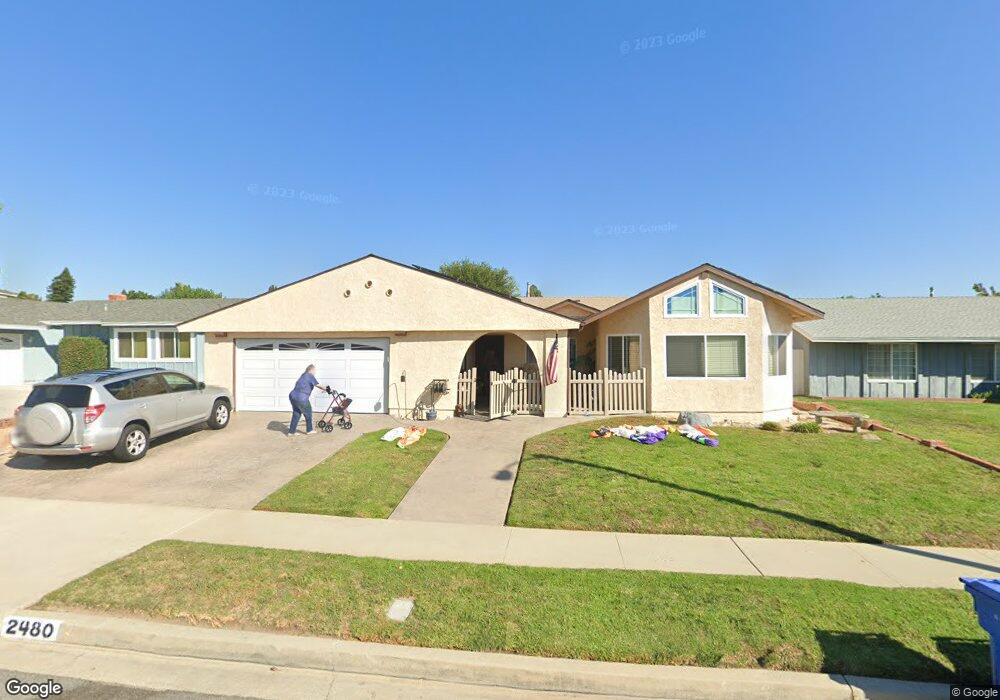
2480 Verda Ct Simi Valley, CA 93065
Central Simi Valley NeighborhoodEstimated Value: $808,000 - $943,000
4
Beds
3
Baths
1,926
Sq Ft
$456/Sq Ft
Est. Value
About This Home
This home is located at 2480 Verda Ct, Simi Valley, CA 93065 and is currently estimated at $878,303, approximately $456 per square foot. 2480 Verda Ct is a home located in Ventura County with nearby schools including Park View Elementary School, Hillside Middle School, and Royal High School.
Ownership History
Date
Name
Owned For
Owner Type
Purchase Details
Closed on
Jun 20, 2018
Sold by
Roe Jennifer Jeanne
Bought by
Roe Jennifer J and The Jennifer Roe Living Trust
Current Estimated Value
Purchase Details
Closed on
Oct 27, 2015
Sold by
Roe Jennifer Jeanne and Bowen Shannon Colleen
Bought by
Roe Jennifer Jeanne
Purchase Details
Closed on
Jun 19, 2012
Sold by
Roe Jennifer Jeanne
Bought by
Bowen Shannon Colleen
Purchase Details
Closed on
Mar 17, 2012
Sold by
Roe Jennifer Jeanne and Bowen Shannon Colleen
Bought by
Roe Jennifer Jeanne
Purchase Details
Closed on
Nov 1, 2002
Sold by
Bowen Ace
Bought by
Bowen Shannon Colleen
Home Financials for this Owner
Home Financials are based on the most recent Mortgage that was taken out on this home.
Original Mortgage
$135,000
Interest Rate
5.88%
Create a Home Valuation Report for This Property
The Home Valuation Report is an in-depth analysis detailing your home's value as well as a comparison with similar homes in the area
Home Values in the Area
Average Home Value in this Area
Purchase History
| Date | Buyer | Sale Price | Title Company |
|---|---|---|---|
| Roe Jennifer J | -- | None Available | |
| Roe Jennifer Jeanne | -- | None Available | |
| Bowen Shannon Colleen | -- | None Available | |
| Roe Jennifer Jeanne | -- | None Available | |
| Bowen Shannon Colleen | -- | Fidelity National Title Co | |
| Roe Jennifer Jeanne | $67,500 | Fidelity National Title Co |
Source: Public Records
Mortgage History
| Date | Status | Borrower | Loan Amount |
|---|---|---|---|
| Previous Owner | Roe Jennifer Jeanne | $135,000 |
Source: Public Records
Tax History
| Year | Tax Paid | Tax Assessment Tax Assessment Total Assessment is a certain percentage of the fair market value that is determined by local assessors to be the total taxable value of land and additions on the property. | Land | Improvement |
|---|---|---|---|---|
| 2025 | $2,010 | $122,381 | $19,556 | $102,825 |
| 2024 | $2,010 | $119,982 | $19,173 | $100,809 |
| 2023 | $1,884 | $117,630 | $18,797 | $98,833 |
| 2022 | $1,842 | $115,324 | $18,428 | $96,896 |
| 2021 | $1,797 | $113,063 | $18,066 | $94,997 |
| 2020 | $1,738 | $111,906 | $17,882 | $94,024 |
| 2019 | $1,653 | $109,713 | $17,532 | $92,181 |
| 2018 | $10,488 | $107,563 | $17,189 | $90,374 |
| 2017 | $6,638 | $105,454 | $16,852 | $88,602 |
| 2016 | $1,561 | $103,387 | $16,522 | $86,865 |
| 2015 | $1,438 | $101,836 | $16,275 | $85,561 |
| 2014 | $1,398 | $99,843 | $15,957 | $83,886 |
Source: Public Records
Map
Nearby Homes
- 2385 N Justin Ave
- 2357 Lawnview Ct
- 2183 E Chesterton St
- 2756 N Dalenhurst Place
- 2371 Larch St
- 2239 McDonald St
- 2516 E Phyllis St
- 2146 N Brower St
- 2325 Wisteria St
- 2752 Wanda Ave
- 2718 Licia Place
- 2091 Marter Ave
- 2189 Latham St
- 2235 Clover St
- 2781 N Woodrow Ave
- 2399 Lee St
- 2405 Lee St
- 1805 Hillary Ct
- 2671 Coral Gum Ln
- 1843 Garvin Ave
Your Personal Tour Guide
Ask me questions while you tour the home.