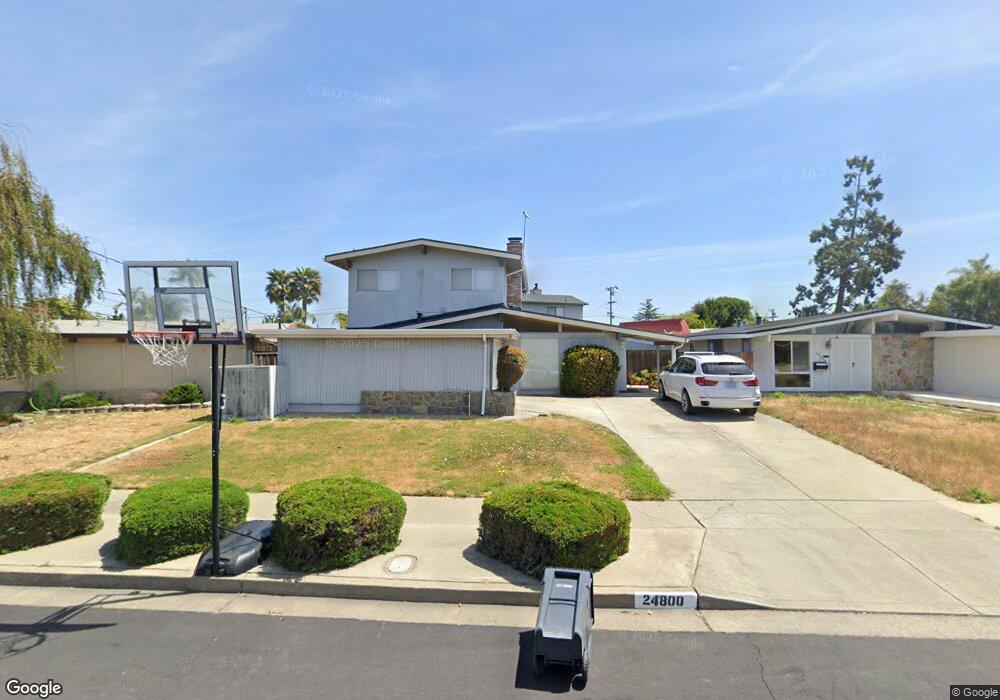
24800 Mango St Hayward, CA 94545
Southgate NeighborhoodEstimated Value: $1,083,000 - $1,154,000
4
Beds
3
Baths
2,100
Sq Ft
$535/Sq Ft
Est. Value
About This Home
This home is located at 24800 Mango St, Hayward, CA 94545 and is currently estimated at $1,123,442, approximately $534 per square foot. 24800 Mango St is a home located in Alameda County with nearby schools including Eden Gardens Elementary School, Anthony W. Ochoa Middle School, and Mt. Eden High School.
Ownership History
Date
Name
Owned For
Owner Type
Purchase Details
Closed on
Feb 13, 2001
Sold by
Temple Floyd P and Temple Donna M
Bought by
Johnson Derrick T and Johnson Pia
Current Estimated Value
Home Financials for this Owner
Home Financials are based on the most recent Mortgage that was taken out on this home.
Original Mortgage
$336,000
Outstanding Balance
$118,370
Interest Rate
6.75%
Estimated Equity
$1,005,072
Create a Home Valuation Report for This Property
The Home Valuation Report is an in-depth analysis detailing your home's value as well as a comparison with similar homes in the area
Home Values in the Area
Average Home Value in this Area
Purchase History
| Date | Buyer | Sale Price | Title Company |
|---|---|---|---|
| Johnson Derrick T | $420,000 | First American Title Guarant |
Source: Public Records
Mortgage History
| Date | Status | Borrower | Loan Amount |
|---|---|---|---|
| Open | Johnson Derrick T | $336,000 | |
| Closed | Johnson Derrick T | $63,000 |
Source: Public Records
Tax History
| Year | Tax Paid | Tax Assessment Tax Assessment Total Assessment is a certain percentage of the fair market value that is determined by local assessors to be the total taxable value of land and additions on the property. | Land | Improvement |
|---|---|---|---|---|
| 2025 | $7,636 | $625,825 | $189,847 | $442,978 |
| 2024 | $7,636 | $613,418 | $186,125 | $434,293 |
| 2023 | $7,521 | $608,255 | $182,476 | $425,779 |
| 2022 | $7,373 | $589,331 | $178,899 | $417,432 |
| 2021 | $7,312 | $577,640 | $175,392 | $409,248 |
| 2020 | $7,231 | $578,645 | $173,593 | $405,052 |
| 2019 | $7,288 | $567,301 | $170,190 | $397,111 |
| 2018 | $6,835 | $556,180 | $166,854 | $389,326 |
| 2017 | $6,676 | $545,277 | $163,583 | $381,694 |
| 2016 | $6,297 | $534,588 | $160,376 | $374,212 |
| 2015 | $6,169 | $526,561 | $157,968 | $368,593 |
| 2014 | $5,856 | $516,250 | $154,875 | $361,375 |
Source: Public Records
Map
Nearby Homes
- 24704 Manzanita St
- 25055 Copa Del Oro Dr Unit 102
- 25164 Copa Del Oro Dr Unit 203
- 25164 Copa Del Oro Dr Unit 104
- 25163 Copa Del Oro Dr Unit 202
- 25129 Copa Del Oro Dr Unit 147
- 937 Neil Way
- 928 Jean Way
- 24839 Townsend Ave
- 1280 Stanhope Ln Unit 246
- 1256 Stanhope Ln Unit 254
- 1256 Stanhope Ln Unit 154
- 1256 Stanhope Ln Unit 251
- 1510 Cathy Way
- 512 Teasdale Place
- 25938 Kay Ave Unit 322
- 23719 Nevada Rd
- 26147 Danforth Ln
- 26088 Kay Ave Unit 318
- 26088 Kay Ave Unit 209
- 24808 Mango St
- 24792 Mango St
- 24799 Papaya St
- 24791 Papaya St
- 24816 Mango St
- 24807 Papaya St
- 24784 Mango St
- 24801 Mango St
- 24809 Mango St
- 24793 Mango St
- 1099 Citron Way
- 1091 Citron Way
- 24815 Papaya St
- 24775 Papaya St
- 24785 Mango St
- 1083 Citron Way
- 24825 Mango St
- 24777 Mango St
- 24790 Papaya St
- 24798 Papaya St
Your Personal Tour Guide
Ask me questions while you tour the home.