24802 Weber Rd Howard, OH 43028
Estimated Value: $279,000 - $331,000
5
Beds
2
Baths
2,343
Sq Ft
$126/Sq Ft
Est. Value
About This Home
This home is located at 24802 Weber Rd, Howard, OH 43028 and is currently estimated at $295,232, approximately $126 per square foot. 24802 Weber Rd is a home located in Knox County with nearby schools including Danville Elementary School, Danville Middle School, and Danville High School.
Ownership History
Date
Name
Owned For
Owner Type
Purchase Details
Closed on
Apr 15, 2011
Sold by
First Place Bank
Bought by
Moore Timothy J and Moore Shari L
Current Estimated Value
Home Financials for this Owner
Home Financials are based on the most recent Mortgage that was taken out on this home.
Original Mortgage
$88,274
Outstanding Balance
$62,854
Interest Rate
5.5%
Mortgage Type
FHA
Estimated Equity
$232,378
Purchase Details
Closed on
Mar 18, 2011
Sold by
Federal Home Loan Mortgage Corporation
Bought by
First Plac Bank
Home Financials for this Owner
Home Financials are based on the most recent Mortgage that was taken out on this home.
Original Mortgage
$88,274
Outstanding Balance
$62,854
Interest Rate
5.5%
Mortgage Type
FHA
Estimated Equity
$232,378
Purchase Details
Closed on
Aug 23, 2004
Sold by
Mullins Danny C and Mullins Rita
Bought by
Mullins Jeffery L
Purchase Details
Closed on
Oct 1, 1990
Sold by
Haddad William J
Bought by
Mullins Danny C and Mullins Rita
Create a Home Valuation Report for This Property
The Home Valuation Report is an in-depth analysis detailing your home's value as well as a comparison with similar homes in the area
Home Values in the Area
Average Home Value in this Area
Purchase History
| Date | Buyer | Sale Price | Title Company |
|---|---|---|---|
| Moore Timothy J | $69,000 | Valmer Land Title Agency Box | |
| First Plac Bank | $675 | Valmer Land Title Agency | |
| Mullins Jeffery L | $162,500 | -- | |
| Mullins Danny C | $47,000 | -- |
Source: Public Records
Mortgage History
| Date | Status | Borrower | Loan Amount |
|---|---|---|---|
| Open | Moore Timothy J | $88,274 |
Source: Public Records
Tax History Compared to Growth
Tax History
| Year | Tax Paid | Tax Assessment Tax Assessment Total Assessment is a certain percentage of the fair market value that is determined by local assessors to be the total taxable value of land and additions on the property. | Land | Improvement |
|---|---|---|---|---|
| 2024 | $1,679 | $50,680 | $12,040 | $38,640 |
| 2023 | $1,679 | $50,680 | $12,040 | $38,640 |
| 2022 | $1,627 | $42,230 | $10,030 | $32,200 |
| 2021 | $1,627 | $42,230 | $10,030 | $32,200 |
| 2020 | $1,528 | $42,230 | $10,030 | $32,200 |
| 2019 | $1,295 | $33,580 | $9,430 | $24,150 |
| 2018 | $1,303 | $33,580 | $9,430 | $24,150 |
| 2017 | $1,271 | $33,580 | $9,430 | $24,150 |
| 2016 | $1,167 | $31,100 | $8,730 | $22,370 |
| 2015 | $1,167 | $31,100 | $8,730 | $22,370 |
| 2014 | $1,172 | $31,100 | $8,730 | $22,370 |
| 2013 | $1,289 | $32,530 | $8,200 | $24,330 |
Source: Public Records
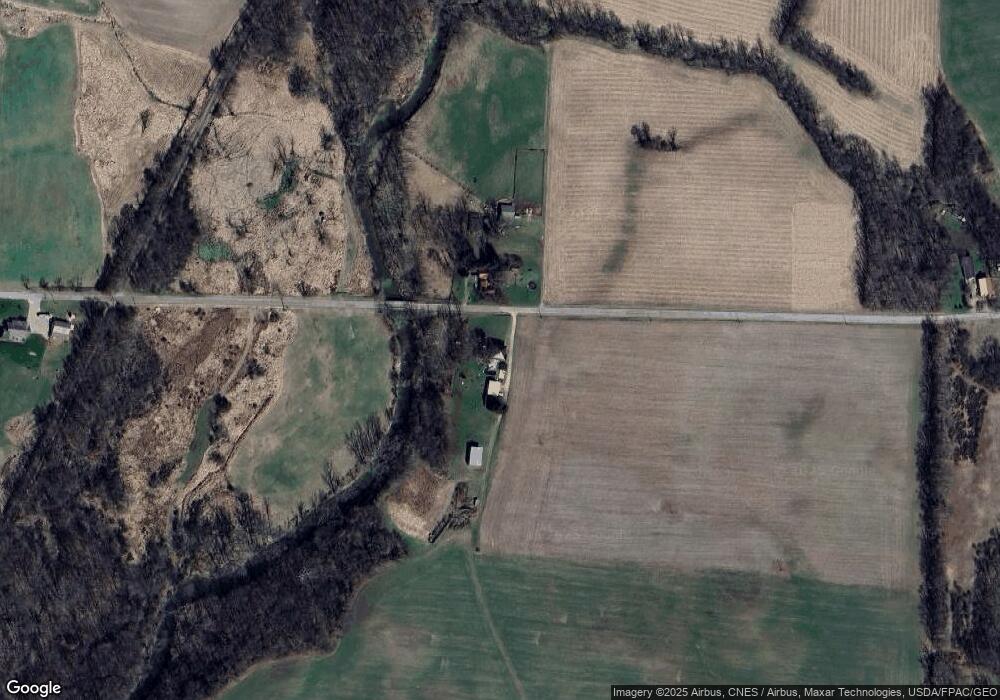
Map
Nearby Homes
- 13904 Carey Ln
- 43 S Highland Ct
- 14119 Magers Rd
- 24057 Coshocton Rd
- 0 Westmoreland Dr Unit 225036591
- 0 Westmoreland Dr Unit 225024813
- 0 Westmoreland Dr Unit 20250682
- 12440 Mary St
- 379 Highland Hills Dr
- 0 Howard-Danville Rd
- 3425 Apple Valley Dr
- 529 King Beach Dr
- 564 Grand Ridge Dr
- 0 King Rd Unit 20250360
- 0 King Rd Unit 225019584
- 544 Grand Ridge Dr
- 441 Grand Ridge Dr
- 0 King Beach Dr Unit 225043317
- 520 King Beach Dr
- 419 Highland Hills Cir