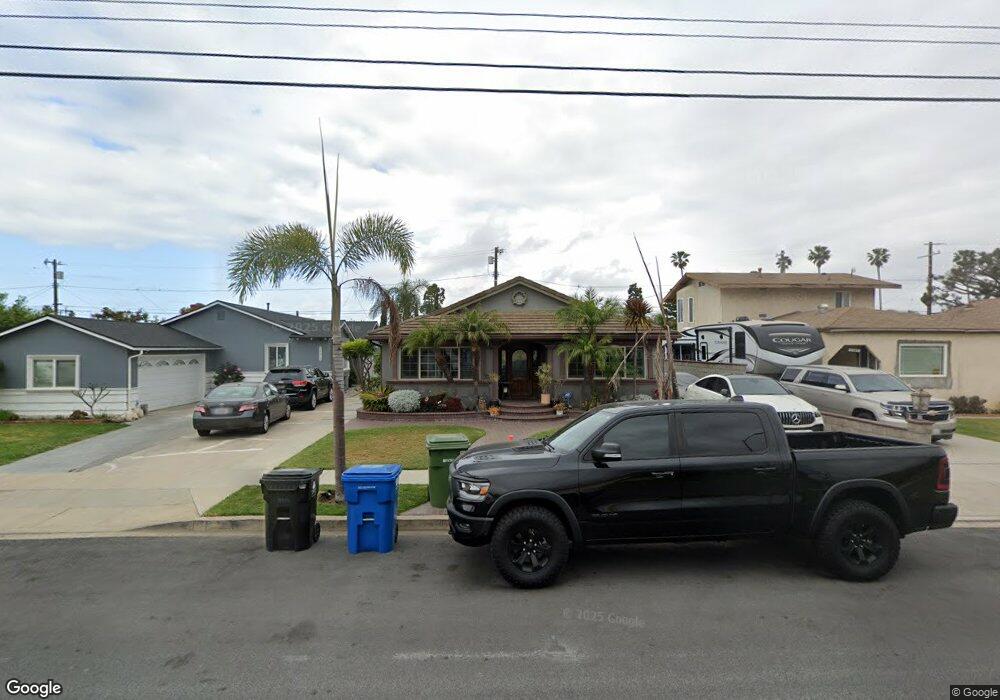
24815 Lakme Ave Wilmington, CA 90744
Estimated Value: $660,000 - $794,308
3
Beds
2
Baths
1,734
Sq Ft
$432/Sq Ft
Est. Value
About This Home
This home is located at 24815 Lakme Ave, Wilmington, CA 90744 and is currently estimated at $748,827, approximately $431 per square foot. 24815 Lakme Ave is a home located in Los Angeles County with nearby schools including Broad Avenue Elementary School, Wilmington Middle School STEAM Magnet, and Phineas Banning Senior High School.
Ownership History
Date
Name
Owned For
Owner Type
Purchase Details
Closed on
Mar 14, 2018
Sold by
Veil Patricia A
Bought by
Veil Darryl M and Veil Patricia A
Current Estimated Value
Purchase Details
Closed on
Mar 7, 2005
Sold by
Veil Darryl M
Bought by
Veil Patricia A
Home Financials for this Owner
Home Financials are based on the most recent Mortgage that was taken out on this home.
Original Mortgage
$200,000
Outstanding Balance
$112,947
Interest Rate
7.37%
Mortgage Type
Purchase Money Mortgage
Estimated Equity
$635,880
Purchase Details
Closed on
Oct 1, 2001
Sold by
Veil Patricia A
Bought by
Veil Darryl M
Purchase Details
Closed on
Jul 15, 1999
Sold by
Veil Darryl M
Bought by
Veil Darryl M and Veil Patricia A
Home Financials for this Owner
Home Financials are based on the most recent Mortgage that was taken out on this home.
Original Mortgage
$125,600
Interest Rate
9.25%
Purchase Details
Closed on
Jun 30, 1997
Sold by
Veil Myron L
Bought by
Veil Darryl M
Create a Home Valuation Report for This Property
The Home Valuation Report is an in-depth analysis detailing your home's value as well as a comparison with similar homes in the area
Home Values in the Area
Average Home Value in this Area
Purchase History
| Date | Buyer | Sale Price | Title Company |
|---|---|---|---|
| Veil Darryl M | -- | None Available | |
| Veil Patricia A | -- | Diversified Title | |
| Veil Darryl M | -- | Stewart Title | |
| Veil Darryl M | -- | Southland Title Corporation | |
| Veil Darryl M | -- | Southland Title Corporation |
Source: Public Records
Mortgage History
| Date | Status | Borrower | Loan Amount |
|---|---|---|---|
| Open | Veil Patricia A | $200,000 | |
| Closed | Veil Darryl M | $125,600 |
Source: Public Records
Tax History Compared to Growth
Tax History
| Year | Tax Paid | Tax Assessment Tax Assessment Total Assessment is a certain percentage of the fair market value that is determined by local assessors to be the total taxable value of land and additions on the property. | Land | Improvement |
|---|---|---|---|---|
| 2025 | $7,408 | $580,288 | $398,238 | $182,050 |
| 2024 | $7,408 | $568,911 | $390,430 | $178,481 |
| 2023 | $7,268 | $557,757 | $382,775 | $174,982 |
| 2022 | $6,940 | $546,821 | $375,270 | $171,551 |
| 2021 | $6,849 | $536,100 | $367,912 | $168,188 |
| 2019 | $6,648 | $520,200 | $357,000 | $163,200 |
| 2018 | $3,572 | $269,065 | $119,523 | $149,542 |
| 2016 | $3,394 | $258,619 | $114,883 | $143,736 |
| 2015 | $3,338 | $254,735 | $113,158 | $141,577 |
| 2014 | $3,345 | $249,746 | $110,942 | $138,804 |
Source: Public Records
Map
Nearby Homes
- 890 Oceanside St
- 810 Oceanside St
- 625 E Bonds St
- 1630 Lakme Ave
- 835 E Bonds St
- 1627 Broad Ave
- 1610 Broad Ave
- 624 E Pacific St
- 639 E Pacific St
- 24407 Island Ave
- 1610 N Fries Ave
- 1526 Lakme Ave
- 24613 Neptune Ave
- 425 E Pacific St
- 24802 Petaluma Ln
- 1603 Lagoon Ave
- 50 Paradise Valley S
- 11 Hickock Ln
- 1607 Ravenna Ave
- 24015 Neptune Ave
- 24809 Lakme Ave
- 24819 Lakme Ave
- 24805 Lakme Ave
- 24801 Lakme Ave
- 24814 Broad Ave
- 24808 Broad Ave
- 24818 Broad Ave
- 24824 Broad Ave
- 24901 Lakme Ave
- 732 E 248th St
- 24800 Broad Ave
- 24820 Lakme Ave
- 24824 Lakme Ave
- 24828 Broad Ave
- 24907 Lakme Ave
- 736 E 248th St
- 24830 Lakme Ave
- 717 E 248th St
- 24909 Lakme Ave
- 24900 Broad Ave