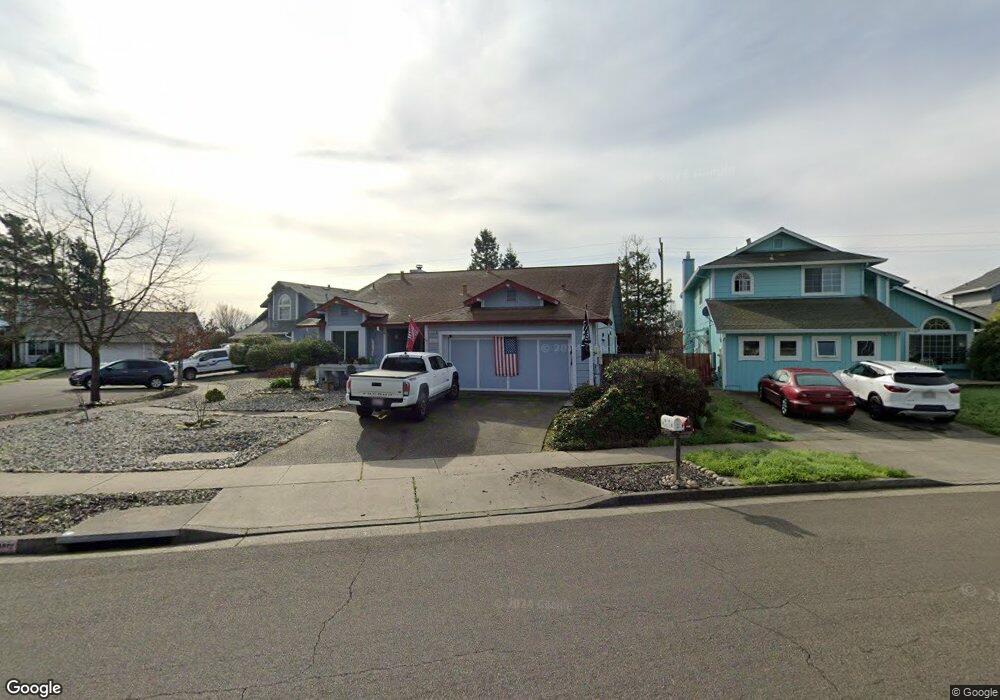
2483 Lemur St Santa Rosa, CA 95401
Copperfield NeighborhoodEstimated Value: $518,000 - $694,000
3
Beds
2
Baths
1,390
Sq Ft
$438/Sq Ft
Est. Value
About This Home
This home is located at 2483 Lemur St, Santa Rosa, CA 95401 and is currently estimated at $609,025, approximately $438 per square foot. 2483 Lemur St is a home located in Sonoma County with nearby schools including J.X. Wilson Elementary School, Elsie Allen High School, and Wright Charter.
Ownership History
Date
Name
Owned For
Owner Type
Purchase Details
Closed on
Nov 7, 2001
Sold by
Plessing Pappas David and Plessing Pappas Linda
Bought by
Plessing Pappas David and Plessing Pappas Linda
Current Estimated Value
Home Financials for this Owner
Home Financials are based on the most recent Mortgage that was taken out on this home.
Original Mortgage
$210,000
Outstanding Balance
$81,473
Interest Rate
6.62%
Estimated Equity
$527,552
Purchase Details
Closed on
Aug 23, 1996
Sold by
Woods Ila Ann Declaration Of Trust and Jack H
Bought by
Pappas David and Plessing Linda A
Home Financials for this Owner
Home Financials are based on the most recent Mortgage that was taken out on this home.
Original Mortgage
$174,500
Interest Rate
8.23%
Mortgage Type
Seller Take Back
Purchase Details
Closed on
Nov 15, 1994
Sold by
Condiotti Daniel L
Bought by
Woods Ila Ann
Create a Home Valuation Report for This Property
The Home Valuation Report is an in-depth analysis detailing your home's value as well as a comparison with similar homes in the area
Home Values in the Area
Average Home Value in this Area
Purchase History
| Date | Buyer | Sale Price | Title Company |
|---|---|---|---|
| Plessing Pappas David | -- | North American Title Co | |
| Pappas David | $182,500 | North Bay Title Co | |
| Woods Ila Ann | $179,000 | North Bay Title Co |
Source: Public Records
Mortgage History
| Date | Status | Borrower | Loan Amount |
|---|---|---|---|
| Open | Plessing Pappas David | $210,000 | |
| Closed | Pappas David | $174,500 |
Source: Public Records
Tax History Compared to Growth
Tax History
| Year | Tax Paid | Tax Assessment Tax Assessment Total Assessment is a certain percentage of the fair market value that is determined by local assessors to be the total taxable value of land and additions on the property. | Land | Improvement |
|---|---|---|---|---|
| 2025 | $3,261 | $291,383 | $119,743 | $171,640 |
| 2024 | $3,261 | $285,671 | $117,396 | $168,275 |
| 2023 | $3,261 | $280,071 | $115,095 | $164,976 |
| 2022 | $3,074 | $274,581 | $112,839 | $161,742 |
| 2021 | $3,017 | $269,198 | $110,627 | $158,571 |
| 2020 | $3,005 | $266,439 | $109,493 | $156,946 |
| 2019 | $2,977 | $261,216 | $107,347 | $153,869 |
| 2018 | $2,952 | $256,095 | $105,243 | $150,852 |
| 2017 | $2,891 | $251,075 | $103,180 | $147,895 |
| 2016 | $2,859 | $246,153 | $101,157 | $144,996 |
| 2015 | $2,766 | $242,457 | $99,638 | $142,819 |
| 2014 | $2,662 | $237,709 | $97,687 | $140,022 |
Source: Public Records
Map
Nearby Homes
- 337 Westmont Place
- 415 Occidental Cir
- 2315 Cross Ave
- 948 Brunello Dr
- 307 Occidental Cir
- 357 Occidental Cir Unit 2
- 2305 Cross Ave
- 314 Michael Dr
- 3677 Sebastopol Rd
- 4025 Sebastopol Rd
- 2400 Valley Dr W
- 2333 Pacheco Place
- 2353 Hood Ct
- 4077 Louis Krohn Dr
- 2154 Longhorn Cir
- 224 Regency Ct
- 438 Rusty Dr
- 226 Regency Ct
- 4049 New Zealand Ave
- 91 Westgate Cir
- 2481 Lemur St
- 2485 Lexington Ct
- 2479 Lemur St
- 2487 Lexington Ct
- 2486 Lemur St
- 2477 Lemur St
- 2484 Lemur St
- 2493 Lemur St
- 2489 Lexington Ct
- 2491 Lexington Ct
- 2475 Lemur St
- 2326 Providence Ct
- 2482 Lemur St
- 2328 Providence Ct
- 2495 Lemur St
- 2480 Lemur St
- 2330 Providence Ct
- 2473 Lemur St
- 2334 Providence Ct
- 2497 Lemur St