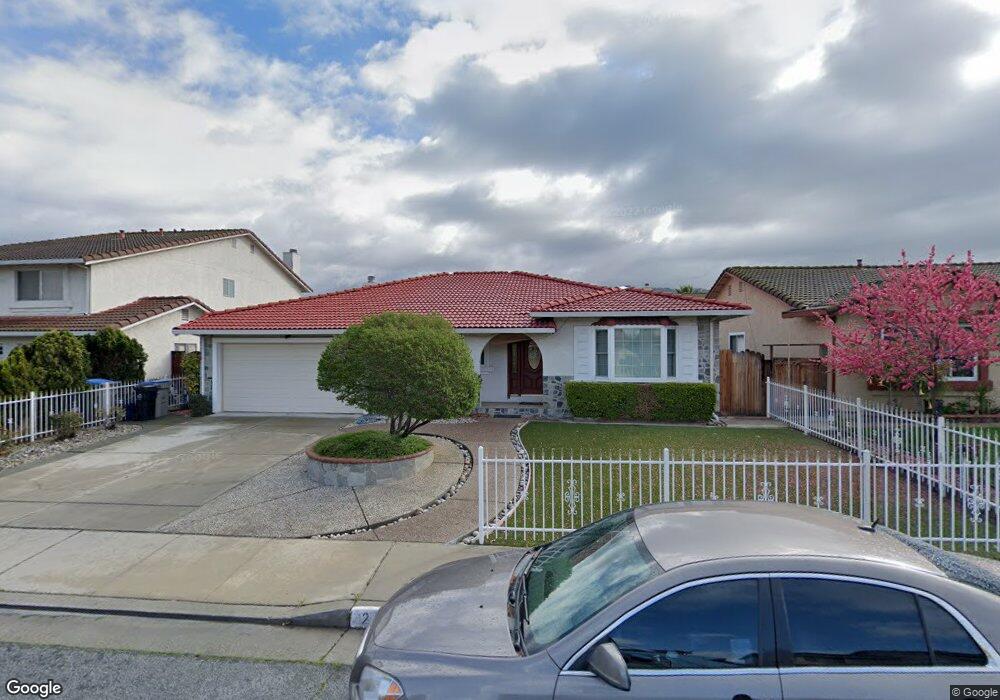
2484 Glen Angus Way San Jose, CA 95148
Hidden Glen NeighborhoodEstimated Value: $752,000 - $1,675,000
4
Beds
2
Baths
2,206
Sq Ft
$627/Sq Ft
Est. Value
About This Home
This home is located at 2484 Glen Angus Way, San Jose, CA 95148 and is currently estimated at $1,383,841, approximately $627 per square foot. 2484 Glen Angus Way is a home located in Santa Clara County with nearby schools including Cedar Grove Elementary School, George V. Leyva Intermediate School, and William C. Overfelt High School.
Ownership History
Date
Name
Owned For
Owner Type
Purchase Details
Closed on
Apr 8, 2019
Sold by
Nguyen Tammy
Bought by
Nguyen Tammy and The Tammy Nguyen Living Trust
Current Estimated Value
Purchase Details
Closed on
May 17, 2016
Sold by
Nguyen Tammy
Bought by
Nguyen Tammy
Home Financials for this Owner
Home Financials are based on the most recent Mortgage that was taken out on this home.
Original Mortgage
$346,000
Interest Rate
3.59%
Mortgage Type
New Conventional
Purchase Details
Closed on
Feb 17, 2006
Sold by
Nguyen Tammy
Bought by
Nguyen Tammy
Purchase Details
Closed on
Dec 3, 2002
Sold by
Miller Michael C and Miller Diana L
Bought by
Nguyen Tammy
Home Financials for this Owner
Home Financials are based on the most recent Mortgage that was taken out on this home.
Original Mortgage
$408,000
Interest Rate
5.25%
Create a Home Valuation Report for This Property
The Home Valuation Report is an in-depth analysis detailing your home's value as well as a comparison with similar homes in the area
Home Values in the Area
Average Home Value in this Area
Purchase History
| Date | Buyer | Sale Price | Title Company |
|---|---|---|---|
| Nguyen Tammy | -- | None Available | |
| Nguyen Tammy | -- | North American Title Co Inc | |
| Nguyen Tammy | -- | None Available | |
| Nguyen Tammy | $512,000 | Chicago Title |
Source: Public Records
Mortgage History
| Date | Status | Borrower | Loan Amount |
|---|---|---|---|
| Previous Owner | Nguyen Tammy | $346,000 | |
| Previous Owner | Nguyen Tammy | $408,000 |
Source: Public Records
Tax History Compared to Growth
Tax History
| Year | Tax Paid | Tax Assessment Tax Assessment Total Assessment is a certain percentage of the fair market value that is determined by local assessors to be the total taxable value of land and additions on the property. | Land | Improvement |
|---|---|---|---|---|
| 2025 | $11,532 | $741,524 | $296,608 | $444,916 |
| 2024 | $11,532 | $726,986 | $290,793 | $436,193 |
| 2023 | $10,678 | $712,733 | $285,092 | $427,641 |
| 2022 | $10,630 | $698,758 | $279,502 | $419,256 |
| 2021 | $10,441 | $685,058 | $274,022 | $411,036 |
| 2020 | $9,989 | $678,035 | $271,213 | $406,822 |
| 2019 | $9,738 | $664,742 | $265,896 | $398,846 |
| 2018 | $9,642 | $651,709 | $260,683 | $391,026 |
| 2017 | $9,489 | $638,931 | $255,572 | $383,359 |
| 2016 | $8,961 | $626,404 | $250,561 | $375,843 |
| 2015 | $8,842 | $616,996 | $246,798 | $370,198 |
| 2014 | $8,156 | $604,911 | $241,964 | $362,947 |
Source: Public Records
Map
Nearby Homes
- 2708 Glen Ferguson Cir
- 2666 Hesselbein Way
- 2707 Sugarplum Dr
- 2689 Vista Verde Dr
- 2715 Sugarplum Dr
- 2955 Vineyard Park Dr
- 2805 Gavilan Dr
- 3324 Trebol Ln
- 2195 Cunningham Ct
- 2017 Flintbury Ct
- 2277 Flint Ave
- 3343 Quesada Dr
- 2552 Castleton Dr
- 3344 Quesada Dr
- 3388 San Saba Dr
- 3144 Coldwater Dr
- 3250 Sylvan Dr
- 3146 Marten Ave
- 1837 S White Rd
- 3368 Thrift Place
- 2480 Glen Angus Way
- 2488 Glen Angus Way
- 2477 Glen Haig Way
- 2473 Glen Haig Way
- 2481 Glen Haig Way
- 2476 Glen Angus Way
- 2492 Glen Angus Way
- 2483 Glen Angus Way
- 2469 Glen Haig Way
- 2485 Glen Haig Way
- 2479 Glen Angus Way
- 2487 Glen Angus Way
- 2472 Glen Angus Way
- 2496 Glen Angus Way
- 2475 Glen Angus Way
- 2465 Glen Haig Way
- 2491 Glen Angus Way
- 2489 Glen Haig Way
- 2471 Glen Angus Way
- 2906 Glen Como Way