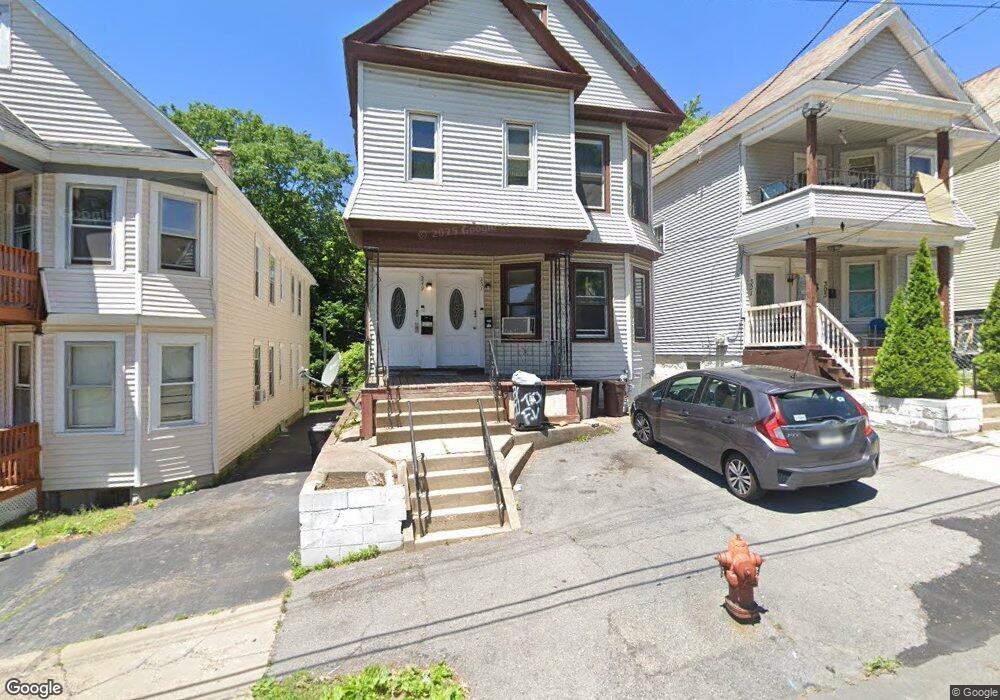
249 Division St Schenectady, NY 12304
Estimated Value: $183,000 - $259,000
5
Beds
2
Baths
2,250
Sq Ft
$96/Sq Ft
Est. Value
About This Home
This home is located at 249 Division St, Schenectady, NY 12304 and is currently estimated at $215,362, approximately $95 per square foot. 249 Division St is a home located in Schenectady County with nearby schools including Lincoln Elementary Community School, Central Park Middle School, and Schenectady High School.
Ownership History
Date
Name
Owned For
Owner Type
Purchase Details
Closed on
Apr 3, 2015
Sold by
Rivera Shirley
Bought by
Rivera Suresh
Current Estimated Value
Purchase Details
Closed on
Oct 20, 2010
Sold by
Federal Home Loan Mortgage Corporation
Bought by
Rivera Suresh
Purchase Details
Closed on
Jul 29, 2010
Sold by
Ingalls Salvatore
Bought by
Fed Home Loan Mortgage Co
Purchase Details
Closed on
Sep 26, 2005
Sold by
Cirabisi Joseph
Bought by
Ingalls Salvatore A
Home Financials for this Owner
Home Financials are based on the most recent Mortgage that was taken out on this home.
Original Mortgage
$68,000
Interest Rate
5.81%
Mortgage Type
New Conventional
Purchase Details
Closed on
Mar 13, 2003
Sold by
Desrochers Dare
Bought by
Cirabise Joseph
Purchase Details
Closed on
Jan 22, 2003
Sold by
Sec Of Hud
Bought by
Desrochers David
Create a Home Valuation Report for This Property
The Home Valuation Report is an in-depth analysis detailing your home's value as well as a comparison with similar homes in the area
Purchase History
| Date | Buyer | Sale Price | Title Company |
|---|---|---|---|
| Rivera Suresh | -- | None Available | |
| Rivera Suresh | $19,000 | None Available | |
| Fed Home Loan Mortgage Co | $34,200 | -- | |
| Federal Home Loan Mortgage Corp | $34,200 | None Available | |
| Ingalls Salvatore A | $85,000 | -- | |
| Cirabise Joseph | $27,555 | -- | |
| Desrochers David | $27,555 | -- |
Source: Public Records
Mortgage History
| Date | Status | Borrower | Loan Amount |
|---|---|---|---|
| Previous Owner | Ingalls Salvatore A | $68,000 |
Source: Public Records
Tax History
| Year | Tax Paid | Tax Assessment Tax Assessment Total Assessment is a certain percentage of the fair market value that is determined by local assessors to be the total taxable value of land and additions on the property. | Land | Improvement |
|---|---|---|---|---|
| 2024 | $5,977 | $89,000 | $13,400 | $75,600 |
| 2023 | $58 | $89,000 | $13,400 | $75,600 |
| 2022 | $5,537 | $89,000 | $13,400 | $75,600 |
| 2021 | $5,483 | $89,000 | $13,400 | $75,600 |
| 2020 | $5,390 | $89,000 | $13,400 | $75,600 |
| 2019 | $3,545 | $89,000 | $13,400 | $75,600 |
| 2018 | $5,434 | $89,000 | $13,400 | $75,600 |
| 2017 | $4,314 | $89,000 | $13,400 | $75,600 |
| 2016 | $5,529 | $89,000 | $13,400 | $75,600 |
| 2015 | -- | $89,000 | $13,400 | $75,600 |
| 2014 | -- | $89,000 | $13,400 | $75,600 |
Source: Public Records
Map
Nearby Homes
- 301 Division St
- 245 Division St
- 305 Division St
- 241 Division St
- 237 Division St
- 307 Division St Unit 307 DIVISION ST
- 315 Division St
- 233 Division St
- 229 -231 Division St
- 231 Division St
- 319 Division St
- 229 Division St Unit 231
- 323 Division St
- 225 Division St
- 302 Division St
- 306 Division St
- 246 Division St
- 327 Division St
- 242 Division St
- 221 Division St
Your Personal Tour Guide
Ask me questions while you tour the home.