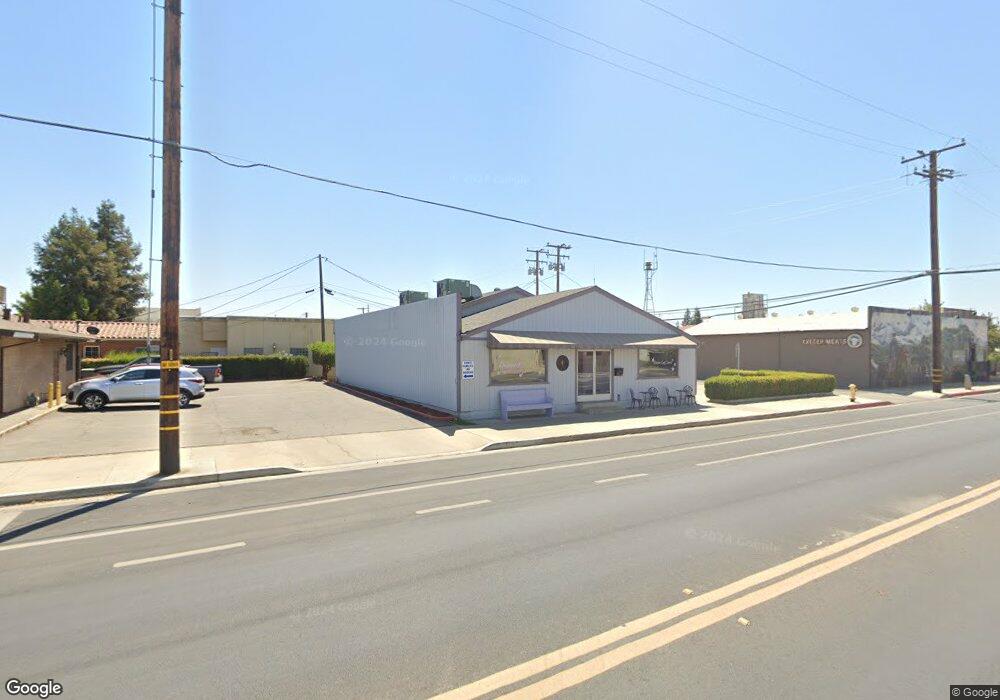
249 S C St Exeter, CA 93221
Estimated Value: $356,000 - $434,000
Studio
--
Bath
2,428
Sq Ft
$163/Sq Ft
Est. Value
About This Home
This home is located at 249 S C St, Exeter, CA 93221 and is currently estimated at $396,833, approximately $163 per square foot. 249 S C St is a home located in Tulare County with nearby schools including Sierra View Junior Academy.
Ownership History
Date
Name
Owned For
Owner Type
Purchase Details
Closed on
Mar 11, 2021
Sold by
Garcia Catalina and Garcia Manuel
Bought by
Garcia Manuel
Current Estimated Value
Home Financials for this Owner
Home Financials are based on the most recent Mortgage that was taken out on this home.
Original Mortgage
$171,500
Outstanding Balance
$154,634
Interest Rate
3.05%
Estimated Equity
$242,199
Purchase Details
Closed on
Oct 4, 2001
Sold by
Woods Anthony J
Bought by
Garcia Manuel and Garcia Catalina
Home Financials for this Owner
Home Financials are based on the most recent Mortgage that was taken out on this home.
Original Mortgage
$111,999
Interest Rate
6.62%
Mortgage Type
FHA
Purchase Details
Closed on
Sep 24, 1998
Sold by
Woods Annette Joyce
Bought by
Woods Anthony J
Home Financials for this Owner
Home Financials are based on the most recent Mortgage that was taken out on this home.
Original Mortgage
$82,500
Interest Rate
6.88%
Purchase Details
Closed on
Sep 6, 1995
Sold by
Poblete Pedro M and Poblete Guadalupe R
Bought by
Woods Anthony J and Woods Annette Joyce
Create a Home Valuation Report for This Property
The Home Valuation Report is an in-depth analysis detailing your home's value as well as a comparison with similar homes in the area
Home Values in the Area
Average Home Value in this Area
Purchase History
| Date | Buyer | Sale Price | Title Company |
|---|---|---|---|
| Garcia Manuel | -- | -- | |
| Garcia Manuel | $113,000 | Chicago Title Co | |
| Woods Anthony J | -- | Chicago Title Co | |
| Woods Anthony J | $30,000 | Chicago Title Co |
Source: Public Records
Mortgage History
| Date | Status | Borrower | Loan Amount |
|---|---|---|---|
| Open | Garcia Manuel | $171,500 | |
| Closed | Garcia Manuel | -- | |
| Previous Owner | Garcia Manuel | $111,999 | |
| Previous Owner | Woods Anthony J | $82,500 |
Source: Public Records
Tax History
| Year | Tax Paid | Tax Assessment Tax Assessment Total Assessment is a certain percentage of the fair market value that is determined by local assessors to be the total taxable value of land and additions on the property. | Land | Improvement |
|---|---|---|---|---|
| 2025 | $1,844 | $166,940 | $36,932 | $130,008 |
| 2024 | $1,844 | $163,667 | $36,208 | $127,459 |
| 2023 | $1,796 | $160,459 | $35,499 | $124,960 |
| 2022 | $1,759 | $157,313 | $34,803 | $122,510 |
| 2021 | $1,746 | $154,229 | $34,121 | $120,108 |
| 2020 | $1,714 | $152,647 | $33,771 | $118,876 |
| 2019 | $1,663 | $149,654 | $33,109 | $116,545 |
| 2018 | $1,602 | $146,720 | $32,460 | $114,260 |
| 2017 | $1,571 | $143,844 | $31,824 | $112,020 |
| 2016 | $1,525 | $141,024 | $31,200 | $109,824 |
| 2015 | $1,510 | $138,905 | $30,731 | $108,174 |
| 2014 | $1,510 | $136,184 | $30,129 | $106,055 |
Source: Public Records
Map
Nearby Homes
- 237 S C St
- 407 E Chestnut St
- 405 E Chestnut St
- 235 S C St
- 256 S Kaweah Ave
- 225 S C St
- 246 S Kaweah Ave
- 404 E Chestnut St
- 234 S B St
- 402 E Chestnut St
- 256 S C St
- 217 S C St
- 230 S B St Unit Exeter Unit C
- 230 S B St
- 230 S B St Unit 1&2
- 230 S B St Unit 2
- 230 S B St Unit A&B
- 230 S B St Unit C
- 230 S B St
- 300 S Kaweah Ave
Your Personal Tour Guide
Ask me questions while you tour the home.