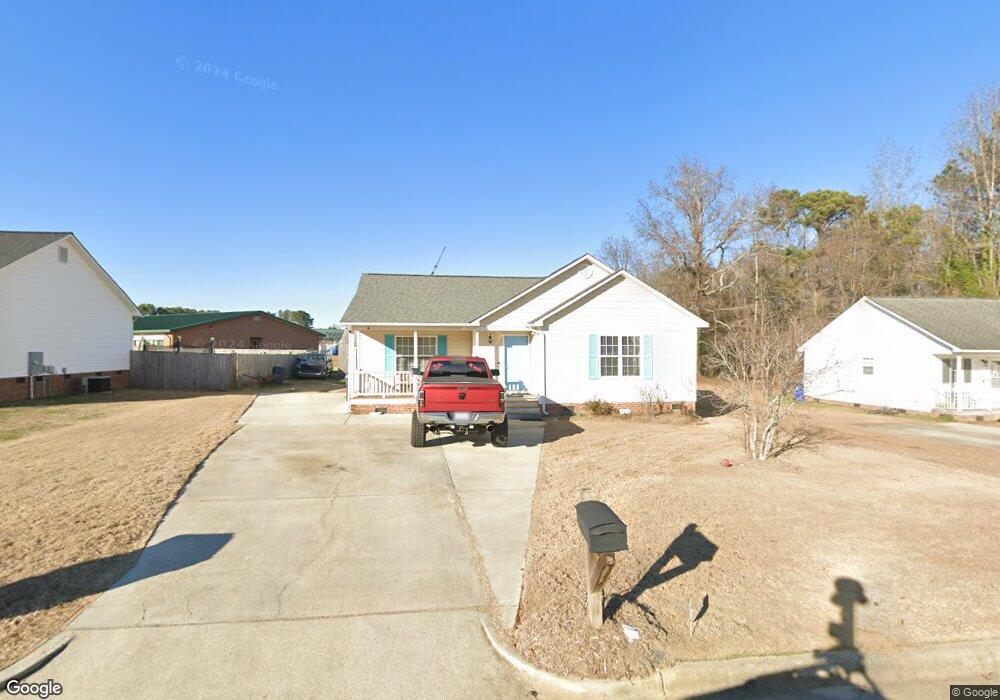
25 Boardwalk Ave Benson, NC 27504
Estimated Value: $258,000 - $288,000
3
Beds
2
Baths
1,232
Sq Ft
$217/Sq Ft
Est. Value
About This Home
This home is located at 25 Boardwalk Ave, Benson, NC 27504 and is currently estimated at $267,264, approximately $216 per square foot. 25 Boardwalk Ave is a home located in Johnston County with nearby schools including Benson Elementary School, Benson Middle School, and South Johnston High School.
Ownership History
Date
Name
Owned For
Owner Type
Purchase Details
Closed on
Mar 12, 2020
Sold by
Dragotta Amy and Dragotta Christopher
Bought by
Vasquez Noe Chavez and Vasquez Udelia E
Current Estimated Value
Home Financials for this Owner
Home Financials are based on the most recent Mortgage that was taken out on this home.
Original Mortgage
$144,485
Outstanding Balance
$128,561
Interest Rate
3.75%
Mortgage Type
FHA
Estimated Equity
$138,703
Purchase Details
Closed on
Feb 6, 2007
Sold by
Vollmer James E
Bought by
Vollmer Mary Lou Collins
Home Financials for this Owner
Home Financials are based on the most recent Mortgage that was taken out on this home.
Original Mortgage
$88,800
Interest Rate
6.17%
Mortgage Type
Purchase Money Mortgage
Purchase Details
Closed on
Oct 19, 2006
Sold by
Scarboro Reginald and Scarboro Tychelle A
Bought by
Hud
Purchase Details
Closed on
Sep 5, 2003
Sold by
Scarboro Reginald
Bought by
Union Planters Bank Na
Create a Home Valuation Report for This Property
The Home Valuation Report is an in-depth analysis detailing your home's value as well as a comparison with similar homes in the area
Home Values in the Area
Average Home Value in this Area
Purchase History
| Date | Buyer | Sale Price | Title Company |
|---|---|---|---|
| Vasquez Noe Chavez | $150,000 | None Available | |
| Vollmer Mary Lou Collins | -- | None Available | |
| Dragotta Amy | -- | None Available | |
| Hud | $91,082 | None Available | |
| Union Planters Bank Na | $82,000 | -- |
Source: Public Records
Mortgage History
| Date | Status | Borrower | Loan Amount |
|---|---|---|---|
| Open | Vasquez Noe Chavez | $144,485 | |
| Previous Owner | Dragotta Amy | $88,800 |
Source: Public Records
Tax History
| Year | Tax Paid | Tax Assessment Tax Assessment Total Assessment is a certain percentage of the fair market value that is determined by local assessors to be the total taxable value of land and additions on the property. | Land | Improvement |
|---|---|---|---|---|
| 2025 | $2,777 | $245,730 | $40,000 | $205,730 |
| 2024 | $1,629 | $127,280 | $40,000 | $87,280 |
| 2023 | $1,629 | $127,280 | $40,000 | $87,280 |
| 2022 | $1,629 | $127,280 | $40,000 | $87,280 |
| 2021 | $1,629 | $127,280 | $40,000 | $87,280 |
| 2020 | $1,642 | $127,280 | $40,000 | $87,280 |
| 2019 | $1,642 | $127,280 | $40,000 | $87,280 |
| 2018 | $1,401 | $106,100 | $24,000 | $82,100 |
| 2017 | $1,401 | $106,100 | $24,000 | $82,100 |
| 2016 | $1,390 | $106,100 | $24,000 | $82,100 |
| 2015 | $1,390 | $106,100 | $24,000 | $82,100 |
| 2014 | $1,390 | $106,100 | $24,000 | $82,100 |
Source: Public Records
Map
Nearby Homes
- 1039 N Lincoln St
- Tract 3 Benson Hardee Rd
- Tract 1 Benson Hardee Rd
- Tract 2 Benson Hardee Rd
- 802 N Lincoln St
- 0 Benson Hardee Rd Unit 10069689
- 704 N Lincoln St
- 15 Denning Farms Ln
- 416 W Martin St
- 702 W Main St
- 508 W Church St
- 1120 W Pope St
- 608 W Parrish Dr
- 0 W Church St
- 301 W Hill St
- 300 S Pine St
- 302 S Pine St
- 314 W Main St
- 212 W Church St
- 415 W Plentiful Way
- 23 Boardwalk Ave
- 27 Boardwalk Ave
- 21 Boardwalk Ave
- 22 Boardwalk Ave
- 20 Boardwalk Ave
- 24 Boardwalk Ave
- 19 Boardwalk Ave
- 18 Boardwalk Ave
- 7 N Carolina Ave
- 7 North Carolina Ave
- 9 N North Carolina Ave
- 9 North Carolina Ave
- 9 N Carolina Ave
- 16 Boardwalk Ave
- 11 Virginia Ave
- 5 North Carolina Ave
- 5 N Carolina Ave
- 9 Virginia Ave
- 3 North Carolina Ave
- 11 N Carolina Ave
Your Personal Tour Guide
Ask me questions while you tour the home.