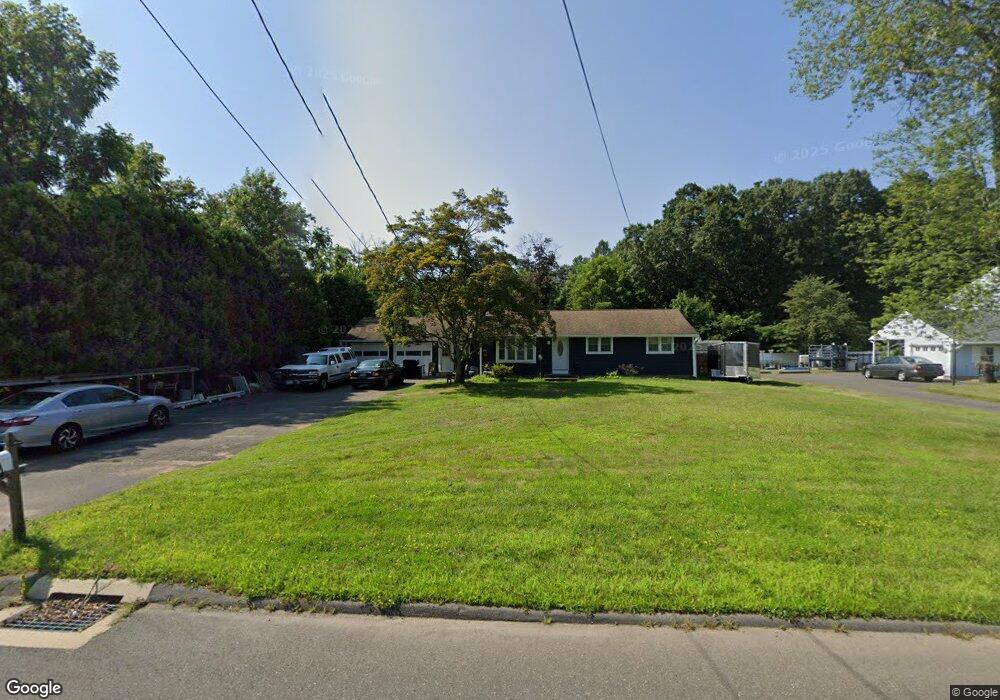
25 Bridge Ln Enfield, CT 06082
Estimated Value: $308,067 - $344,000
3
Beds
1
Bath
1,008
Sq Ft
$325/Sq Ft
Est. Value
About This Home
This home is located at 25 Bridge Ln, Enfield, CT 06082 and is currently estimated at $327,767, approximately $325 per square foot. 25 Bridge Ln is a home located in Hartford County with nearby schools including Enfield Street Elementary School, Edgar H. Parkman School, and John F. Kennedy Middle School.
Ownership History
Date
Name
Owned For
Owner Type
Purchase Details
Closed on
Aug 9, 2016
Sold by
James Nicole
Bought by
James Glen
Current Estimated Value
Home Financials for this Owner
Home Financials are based on the most recent Mortgage that was taken out on this home.
Original Mortgage
$15,000
Interest Rate
3.45%
Mortgage Type
Credit Line Revolving
Purchase Details
Closed on
May 23, 2003
Sold by
Alhano Gary and Alhano Joanne
Bought by
James Glen
Purchase Details
Closed on
Oct 10, 1996
Sold by
Sweeney John
Bought by
Albano Gary and Albano Joanne
Create a Home Valuation Report for This Property
The Home Valuation Report is an in-depth analysis detailing your home's value as well as a comparison with similar homes in the area
Home Values in the Area
Average Home Value in this Area
Purchase History
| Date | Buyer | Sale Price | Title Company |
|---|---|---|---|
| James Glen | -- | -- | |
| James Glen | $154,300 | -- | |
| Albano Gary | $115,000 | -- |
Source: Public Records
Mortgage History
| Date | Status | Borrower | Loan Amount |
|---|---|---|---|
| Closed | Albano Gary | $15,000 | |
| Previous Owner | Albano Gary | $25,000 | |
| Previous Owner | Albano Gary | $87,883 |
Source: Public Records
Tax History Compared to Growth
Tax History
| Year | Tax Paid | Tax Assessment Tax Assessment Total Assessment is a certain percentage of the fair market value that is determined by local assessors to be the total taxable value of land and additions on the property. | Land | Improvement |
|---|---|---|---|---|
| 2025 | $5,511 | $157,500 | $62,200 | $95,300 |
| 2024 | $5,363 | $157,500 | $62,200 | $95,300 |
| 2023 | $5,324 | $157,500 | $62,200 | $95,300 |
| 2022 | $4,834 | $157,500 | $62,200 | $95,300 |
| 2021 | $4,994 | $133,070 | $53,670 | $79,400 |
| 2020 | $4,994 | $133,070 | $53,670 | $79,400 |
| 2019 | $5,007 | $133,070 | $53,670 | $79,400 |
| 2018 | $4,924 | $133,070 | $53,670 | $79,400 |
| 2017 | $4,648 | $133,070 | $53,670 | $79,400 |
| 2016 | $4,498 | $131,090 | $53,670 | $77,420 |
| 2015 | $4,357 | $131,090 | $53,670 | $77,420 |
| 2014 | $4,245 | $131,090 | $53,670 | $77,420 |
Source: Public Records
Map
Nearby Homes
- 5 Spier Ave
- 3 Green Briar Dr Unit 3
- 1165 Enfield St Unit 11
- 6 Hathaway Ave
- 1527 King St
- 8 Frew Terrace
- 92 Post Office Rd
- 33 Frew Terrace
- 29 Primrose Ln
- 1070 Enfield St
- 779 Bridge St
- 78 Landing Cir Unit 78
- 1561 King St
- 21 Pebblestone Cir
- 20 Greendale Dr
- 105 Spring Ln Unit 105
- 1015 Enfield St
- 69 Prospect St
- 53 New King St
- 180 Dusky Ln