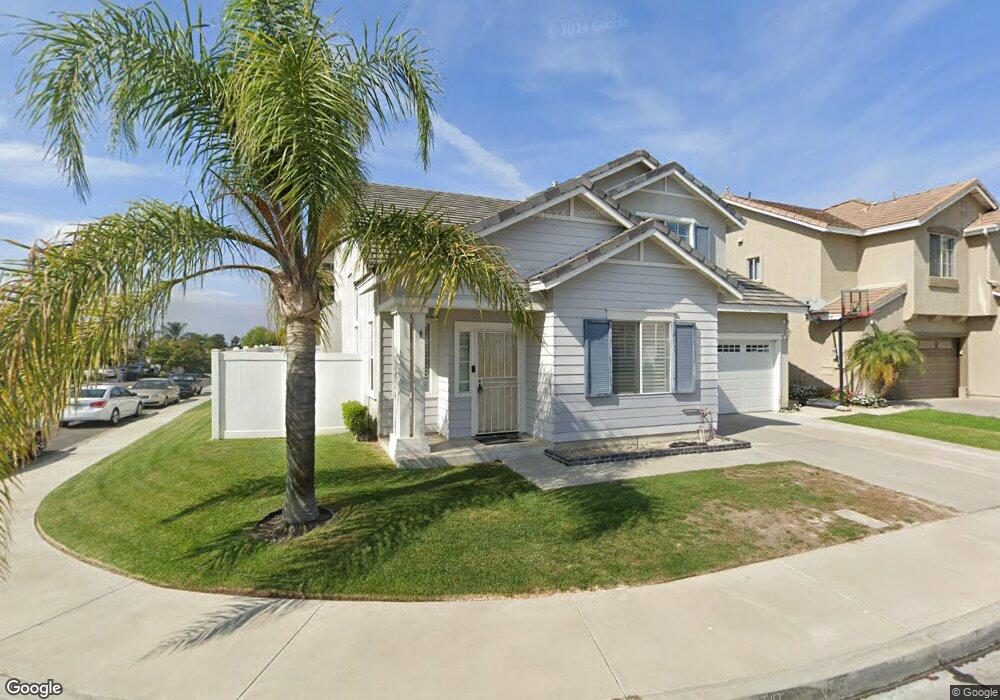
25 Calotte Place Foothill Ranch, CA 92610
Estimated Value: $1,049,000 - $1,162,000
3
Beds
3
Baths
1,663
Sq Ft
$670/Sq Ft
Est. Value
About This Home
This home is located at 25 Calotte Place, Foothill Ranch, CA 92610 and is currently estimated at $1,113,533, approximately $669 per square foot. 25 Calotte Place is a home located in Orange County with nearby schools including Foothill Ranch Elementary School, Rancho Santa Margarita Intermediate School, and Trabuco Hills High School.
Ownership History
Date
Name
Owned For
Owner Type
Purchase Details
Closed on
Dec 21, 1998
Sold by
Mason George R and Mason Dyanna P
Bought by
Mason George R and Mason Dyanna P
Current Estimated Value
Home Financials for this Owner
Home Financials are based on the most recent Mortgage that was taken out on this home.
Original Mortgage
$173,300
Outstanding Balance
$39,807
Interest Rate
6.91%
Estimated Equity
$1,073,726
Purchase Details
Closed on
Oct 15, 1996
Sold by
2728 Holding Corp
Bought by
Mason George R and Jacks Dyanna P
Home Financials for this Owner
Home Financials are based on the most recent Mortgage that was taken out on this home.
Original Mortgage
$172,750
Interest Rate
7.58%
Create a Home Valuation Report for This Property
The Home Valuation Report is an in-depth analysis detailing your home's value as well as a comparison with similar homes in the area
Home Values in the Area
Average Home Value in this Area
Purchase History
| Date | Buyer | Sale Price | Title Company |
|---|---|---|---|
| Mason George R | -- | -- | |
| Mason George R | $194,000 | Chicago Title Company |
Source: Public Records
Mortgage History
| Date | Status | Borrower | Loan Amount |
|---|---|---|---|
| Open | Mason George R | $173,300 | |
| Previous Owner | Mason George R | $172,750 |
Source: Public Records
Tax History
| Year | Tax Paid | Tax Assessment Tax Assessment Total Assessment is a certain percentage of the fair market value that is determined by local assessors to be the total taxable value of land and additions on the property. | Land | Improvement |
|---|---|---|---|---|
| 2025 | $3,165 | $315,952 | $115,662 | $200,290 |
| 2024 | $3,165 | $309,757 | $113,394 | $196,363 |
| 2023 | $3,089 | $303,684 | $111,171 | $192,513 |
| 2022 | $3,033 | $297,730 | $108,991 | $188,739 |
| 2021 | $2,352 | $291,893 | $106,854 | $185,039 |
| 2020 | $2,944 | $288,900 | $105,758 | $183,142 |
| 2019 | $2,884 | $283,236 | $103,685 | $179,551 |
| 2018 | $2,829 | $277,683 | $101,652 | $176,031 |
| 2017 | $2,756 | $272,239 | $99,659 | $172,580 |
| 2016 | $3,416 | $266,901 | $97,704 | $169,197 |
| 2015 | $3,425 | $262,892 | $96,236 | $166,656 |
| 2014 | $4,009 | $257,743 | $94,351 | $163,392 |
Source: Public Records
Map
Nearby Homes
- 19431 Rue de Valore Unit 19B
- 19431 Rue de Valore Unit 37A
- 19431 14H Rue de Valore
- 19431 57D Rue de Valore
- 39 Touraine Place
- 51 Toulon Ave
- 56 Tessera Ave
- 1161 Summit Oak Dr
- 506 Deeann
- 704 Dusky Creek
- 109 Alder Ridge
- 420 Coyote Pass
- 201 Mountain Sage
- 606 White Oaks
- 207 Winterbrook
- 608 Shadowbrook
- 20 Flores
- 115 Primrose Dr
- 1621 Sunset View Dr
- 28372 Boulder Dr
- 23 Calotte Place
- 62 Parterre Ave
- 60 Parterre Ave
- 21 Calotte Place
- 58 Parterre Ave
- 24 Carillon Place
- 22 Carillon Place
- 24 Calotte Place
- 28 Calotte Place
- 26 Carillon Place
- 30 Calotte Place
- 20 Carillon Place
- 20 Calotte Place
- 19 Calotte Place
- 56 Parterre Ave
- 17 Carillon Place
- 18 Carillon Place
- 31 Balustrade Place
- 29 Balustrade Place
- 18 Calotte Place
Your Personal Tour Guide
Ask me questions while you tour the home.