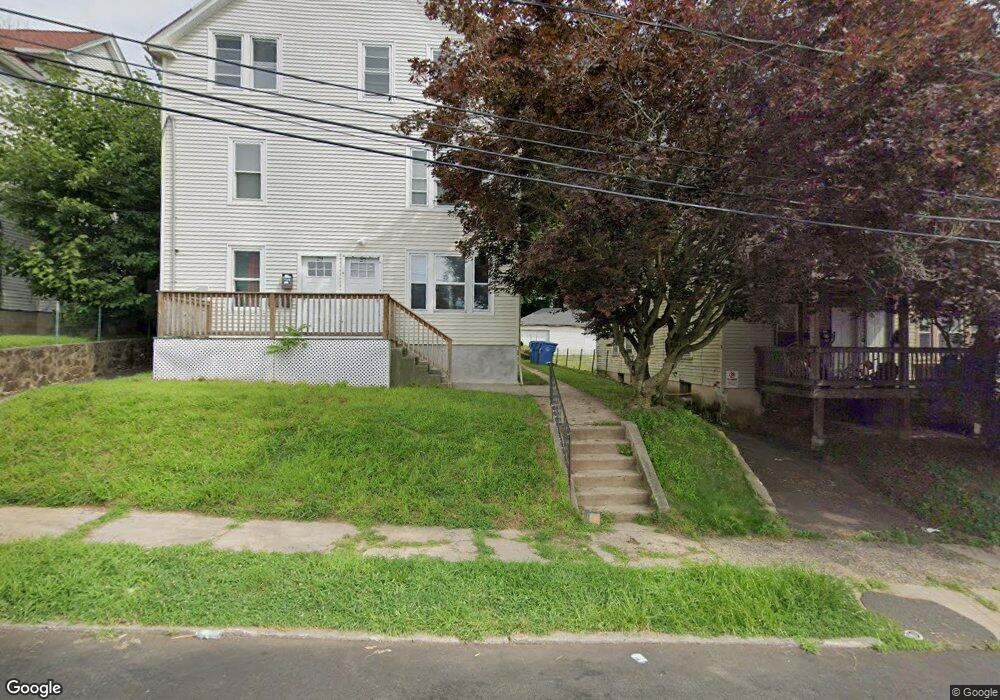
25 Chapman Ct New Britain, CT 06051
Estimated Value: $250,000 - $299,968
2
Beds
1
Bath
1,250
Sq Ft
$229/Sq Ft
Est. Value
About This Home
This home is located at 25 Chapman Ct, New Britain, CT 06051 and is currently estimated at $285,992, approximately $228 per square foot. 25 Chapman Ct is a home located in Hartford County with nearby schools including Slade Middle School, Emmanuel Christian Academy, and Mountain Laurel Sudbury School.
Ownership History
Date
Name
Owned For
Owner Type
Purchase Details
Closed on
Jun 16, 2004
Sold by
Torres Marcial and Torres Elba Iris
Bought by
Rodriguez Catherine I and Rodriguez Jose A
Current Estimated Value
Home Financials for this Owner
Home Financials are based on the most recent Mortgage that was taken out on this home.
Original Mortgage
$118,100
Outstanding Balance
$58,196
Interest Rate
6.12%
Estimated Equity
$227,796
Purchase Details
Closed on
Aug 29, 1997
Sold by
Oceanmark Bank
Bought by
Kirouac Eugene
Purchase Details
Closed on
Dec 24, 1996
Sold by
Weatherspoon Phillip
Bought by
Henton June S
Purchase Details
Closed on
Nov 4, 1996
Sold by
Henton June S
Bought by
Weatherspoon Phillip
Purchase Details
Closed on
May 23, 1996
Sold by
Hasson Ruby Est
Bought by
Henton June S
Home Financials for this Owner
Home Financials are based on the most recent Mortgage that was taken out on this home.
Original Mortgage
$53,250
Interest Rate
8.21%
Create a Home Valuation Report for This Property
The Home Valuation Report is an in-depth analysis detailing your home's value as well as a comparison with similar homes in the area
Home Values in the Area
Average Home Value in this Area
Purchase History
| Date | Buyer | Sale Price | Title Company |
|---|---|---|---|
| Rodriguez Catherine I | $120,000 | -- | |
| Kirouac Eugene | $17,500 | -- | |
| Henton June S | $57,000 | -- | |
| Weatherspoon Phillip | $57,000 | -- | |
| Henton June S | $25,000 | -- |
Source: Public Records
Mortgage History
| Date | Status | Borrower | Loan Amount |
|---|---|---|---|
| Open | Henton June S | $118,100 | |
| Previous Owner | Henton June S | $12,563 | |
| Previous Owner | Henton June S | $53,250 |
Source: Public Records
Tax History Compared to Growth
Tax History
| Year | Tax Paid | Tax Assessment Tax Assessment Total Assessment is a certain percentage of the fair market value that is determined by local assessors to be the total taxable value of land and additions on the property. | Land | Improvement |
|---|---|---|---|---|
| 2025 | $5,869 | $149,800 | $50,120 | $99,680 |
| 2024 | $5,931 | $149,800 | $50,120 | $99,680 |
| 2023 | $5,734 | $149,800 | $50,120 | $99,680 |
| 2022 | $4,941 | $99,820 | $23,100 | $76,720 |
| 2021 | $4,941 | $99,820 | $23,100 | $76,720 |
| 2020 | $5,041 | $99,820 | $23,100 | $76,720 |
| 2019 | $5,041 | $99,820 | $23,100 | $76,720 |
| 2018 | $5,041 | $99,820 | $23,100 | $76,720 |
| 2017 | $4,659 | $92,260 | $23,100 | $69,160 |
| 2016 | $4,659 | $92,260 | $23,100 | $69,160 |
| 2015 | $4,521 | $92,260 | $23,100 | $69,160 |
| 2014 | $4,521 | $92,260 | $23,100 | $69,160 |
Source: Public Records
Map
Nearby Homes