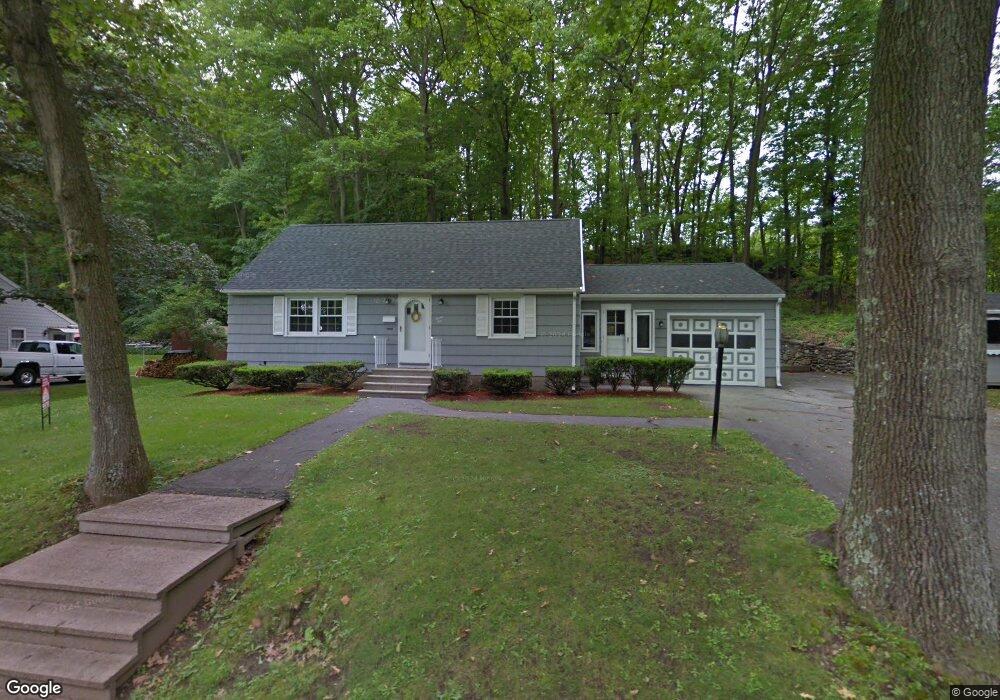
25 Linda Ave Auburn, MA 01501
West Auburn NeighborhoodEstimated Value: $421,000 - $440,000
3
Beds
1
Bath
1,472
Sq Ft
$295/Sq Ft
Est. Value
About This Home
This home is located at 25 Linda Ave, Auburn, MA 01501 and is currently estimated at $434,893, approximately $295 per square foot. 25 Linda Ave is a home located in Worcester County with nearby schools including Auburn Senior High School and Shrewsbury Montessori School - Auburn Campus.
Ownership History
Date
Name
Owned For
Owner Type
Purchase Details
Closed on
Oct 17, 2014
Sold by
Gmr Rt
Bought by
Macleod James and Macleod Nichole
Current Estimated Value
Home Financials for this Owner
Home Financials are based on the most recent Mortgage that was taken out on this home.
Original Mortgage
$224,730
Outstanding Balance
$172,225
Interest Rate
4.09%
Mortgage Type
New Conventional
Estimated Equity
$262,668
Purchase Details
Closed on
Apr 8, 2011
Sold by
Es Cantwell Margaret M and Degon Margaret A
Bought by
Gmr Rt
Create a Home Valuation Report for This Property
The Home Valuation Report is an in-depth analysis detailing your home's value as well as a comparison with similar homes in the area
Home Values in the Area
Average Home Value in this Area
Purchase History
| Date | Buyer | Sale Price | Title Company |
|---|---|---|---|
| Macleod James | $220,000 | -- | |
| Gmr Rt | $150,000 | -- | |
| Gmr Rt | $150,000 | -- |
Source: Public Records
Mortgage History
| Date | Status | Borrower | Loan Amount |
|---|---|---|---|
| Open | Macleod James | $224,730 | |
| Closed | Gmr Rt | $224,730 |
Source: Public Records
Tax History Compared to Growth
Tax History
| Year | Tax Paid | Tax Assessment Tax Assessment Total Assessment is a certain percentage of the fair market value that is determined by local assessors to be the total taxable value of land and additions on the property. | Land | Improvement |
|---|---|---|---|---|
| 2025 | $54 | $374,600 | $116,100 | $258,500 |
| 2024 | $4,984 | $333,800 | $111,300 | $222,500 |
| 2023 | $4,897 | $308,400 | $101,200 | $207,200 |
| 2022 | $4,572 | $271,800 | $101,200 | $170,600 |
| 2021 | $4,302 | $235,800 | $89,300 | $146,500 |
| 2020 | $0 | $229,900 | $89,300 | $140,600 |
| 2019 | $3,880 | $217,100 | $88,500 | $128,600 |
| 2018 | $3,647 | $204,000 | $82,700 | $121,300 |
| 2017 | $17,665 | $196,300 | $75,000 | $121,300 |
| 2016 | $0 | $191,800 | $78,000 | $113,800 |
| 2015 | $3,171 | $183,700 | $78,000 | $105,700 |
| 2014 | $3,060 | $177,000 | $82,700 | $94,300 |
Source: Public Records
Map
Nearby Homes