Estimated Value: $2,120,000 - $2,494,991
3
Beds
3
Baths
1,956
Sq Ft
$1,203/Sq Ft
Est. Value
About This Home
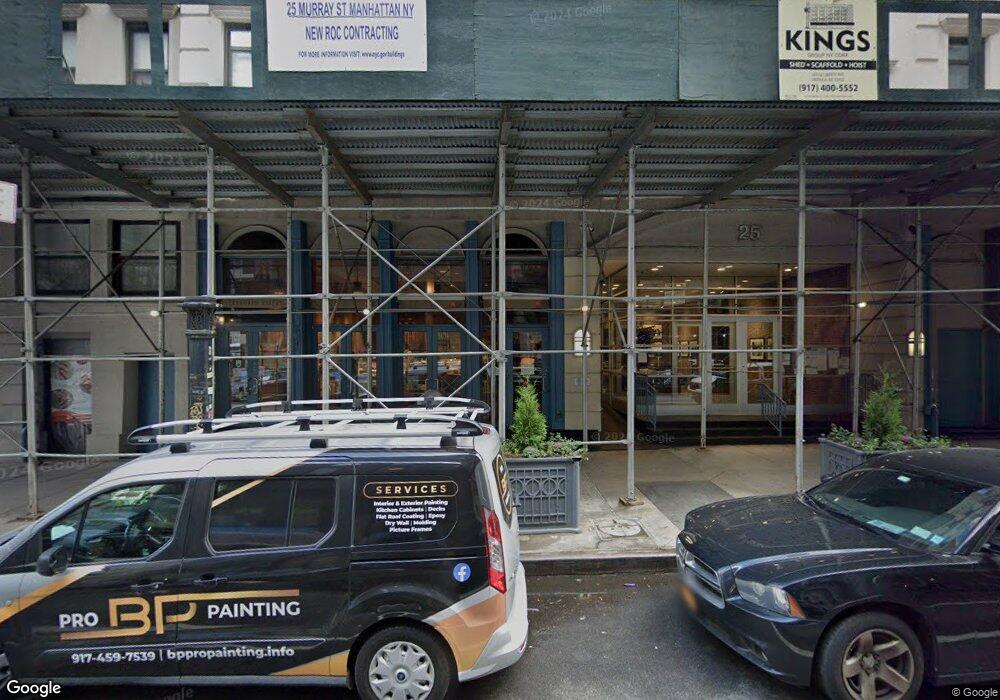
This home is located at 25 Murray St Unit 8A, New York, NY 10007 and is currently estimated at $2,353,748, approximately $1,203 per square foot. 25 Murray St Unit 8A is a home located in New York County with nearby schools including P.S. 397 Spruce Street School, Lower Manhattan Community Middle School, and Clinton School.
Ownership History
Date
Name
Owned For
Owner Type
Purchase Details
Closed on
Jul 24, 2025
Sold by
Ghee Aileen D and Rendine Jr. Robert J
Bought by
Chin-Lee Yun-Ke and Stern Matthew
Current Estimated Value
Home Financials for this Owner
Home Financials are based on the most recent Mortgage that was taken out on this home.
Original Mortgage
$1,760,000
Outstanding Balance
$1,756,996
Interest Rate
6.81%
Mortgage Type
Purchase Money Mortgage
Estimated Equity
$596,752
Purchase Details
Closed on
Mar 3, 2011
Sold by
Tribeca Mews Ltd
Bought by
Ghee Aileen D and Rendine Robert J
Home Financials for this Owner
Home Financials are based on the most recent Mortgage that was taken out on this home.
Original Mortgage
$600,000
Interest Rate
4.84%
Mortgage Type
Purchase Money Mortgage
Create a Home Valuation Report for This Property
The Home Valuation Report is an in-depth analysis detailing your home's value as well as a comparison with similar homes in the area
Home Values in the Area
Average Home Value in this Area
Purchase History
| Date | Buyer | Sale Price | Title Company |
|---|---|---|---|
| Chin-Lee Yun-Ke | $2,200,000 | -- | |
| Ghee Aileen D | $2,011,044 | -- | |
| Ghee Aileen D | $2,011,044 | -- |
Source: Public Records
Mortgage History
| Date | Status | Borrower | Loan Amount |
|---|---|---|---|
| Open | Chin-Lee Yun-Ke | $1,760,000 | |
| Previous Owner | Ghee Aileen D | $600,000 |
Source: Public Records
Tax History Compared to Growth
Tax History
| Year | Tax Paid | Tax Assessment Tax Assessment Total Assessment is a certain percentage of the fair market value that is determined by local assessors to be the total taxable value of land and additions on the property. | Land | Improvement |
|---|---|---|---|---|
| 2025 | $33,796 | $275,497 | $61,651 | $213,846 |
| 2024 | $33,796 | $270,323 | $61,651 | $208,672 |
| 2023 | $33,361 | $266,846 | $61,651 | $205,195 |
| 2022 | $26,250 | $260,705 | $61,651 | $199,054 |
| 2021 | $31,981 | $260,707 | $61,651 | $199,056 |
| 2020 | $27,164 | $288,759 | $61,651 | $227,108 |
| 2019 | $26,289 | $282,269 | $61,651 | $220,618 |
| 2018 | $30,657 | $262,027 | $61,651 | $200,376 |
| 2017 | $29,658 | $252,569 | $61,651 | $190,918 |
| 2016 | $29,691 | $272,965 | $61,652 | $211,313 |
| 2015 | $13,930 | $228,287 | $61,651 | $166,636 |
| 2014 | $13,930 | $213,922 | $61,651 | $152,271 |
Source: Public Records
About This Building
Map
Nearby Homes
- 19 Murray St Unit 4
- 25 Murray St Unit 8F
- 9 Murray St Unit 5SE
- 19 Park Place Unit 14A
- 19 Park Place Unit PH
- 19 Park Place Unit 4B
- 30 Warren St Unit PH1
- 16 Warren St Unit 5
- 16 Warren St Unit PH
- 8 Warren St Unit 3W
- 37 Warren St Unit PHCD
- 43 Murray St Unit 2
- 30 Park Place Unit 52C
- 30 Park Place Unit 50D
- 30 Park Place Unit 54A
- 30 Park Place Unit 47C
- 30 Park Place Unit 60B
- 30 Park Place Unit 60C
- 30 Park Place Unit 64B
- 30 Park Place Unit 42C
- 25 Murray St Unit PH10H
- 25 Murray St Unit PH10G
- 25 Murray St Unit PH10F
- 25 Murray St Unit PH10E
- 25 Murray St Unit PH10D
- 25 Murray St Unit PH10C
- 25 Murray St Unit PH10B
- 25 Murray St Unit PH10A
- 25 Murray St Unit 9G
- 25 Murray St Unit 9F
- 25 Murray St Unit 9E
- 25 Murray St Unit 9D
- 25 Murray St Unit 9C
- 25 Murray St Unit 9B
- 25 Murray St Unit 8H
- 25 Murray St Unit 8G
- 25 Murray St Unit 8E
- 25 Murray St Unit 8D
- 25 Murray St Unit 8C
- 25 Murray St Unit 8B