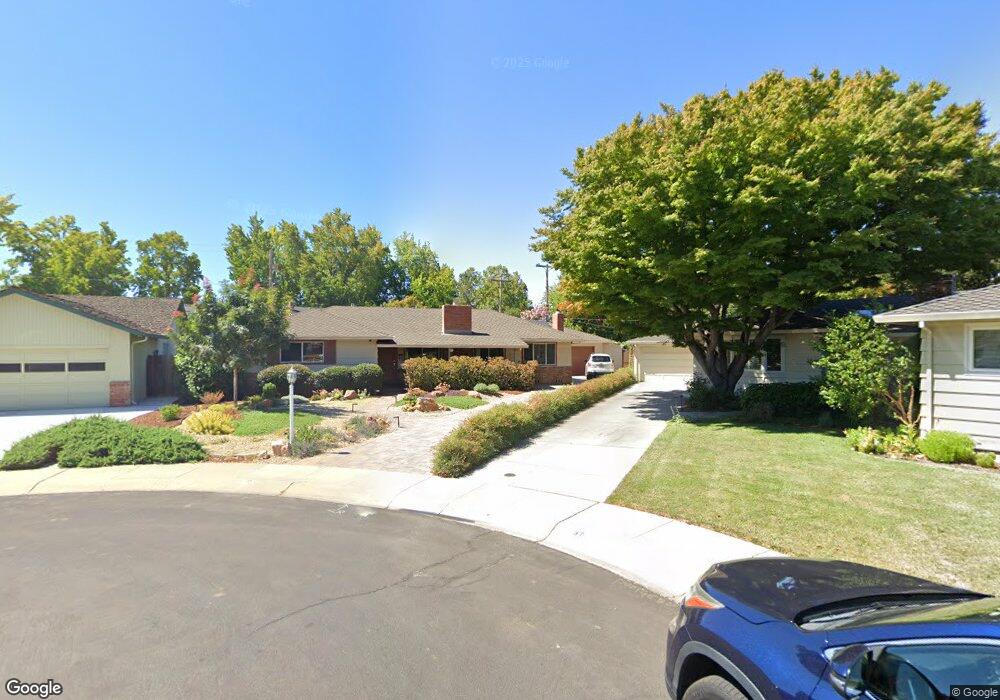
25 Peter Ct Campbell, CA 95008
Estimated Value: $2,475,000 - $2,704,537
4
Beds
3
Baths
2,078
Sq Ft
$1,247/Sq Ft
Est. Value
About This Home
This home is located at 25 Peter Ct, Campbell, CA 95008 and is currently estimated at $2,590,384, approximately $1,246 per square foot. 25 Peter Ct is a home located in Santa Clara County with nearby schools including Del Mar High School, Blackford Elementary, and Fammatre Elementary School.
Ownership History
Date
Name
Owned For
Owner Type
Purchase Details
Closed on
Mar 29, 2012
Sold by
Ulrich Lynn D and Ulrich Jeanne F
Bought by
Ulrich Lynn D and Ulrich Jeanne F
Current Estimated Value
Home Financials for this Owner
Home Financials are based on the most recent Mortgage that was taken out on this home.
Original Mortgage
$350,000
Interest Rate
3%
Mortgage Type
Adjustable Rate Mortgage/ARM
Purchase Details
Closed on
Jul 31, 2009
Sold by
Ulrich Lynn D and Ulrich Jeanne F
Bought by
Ulrich Lynn D and Ulrich Jeanne F
Home Financials for this Owner
Home Financials are based on the most recent Mortgage that was taken out on this home.
Original Mortgage
$417,000
Interest Rate
5.37%
Mortgage Type
New Conventional
Purchase Details
Closed on
May 11, 1998
Sold by
Ulrich Jeanne F and Ulrich Lynn D
Bought by
Ulrich Lynn D and Ulrich Jeanne F
Create a Home Valuation Report for This Property
The Home Valuation Report is an in-depth analysis detailing your home's value as well as a comparison with similar homes in the area
Home Values in the Area
Average Home Value in this Area
Purchase History
| Date | Buyer | Sale Price | Title Company |
|---|---|---|---|
| Ulrich Lynn D | -- | Accommodation | |
| Ulrich Lynn D | -- | Lsi Title Company | |
| Ulrich Lynn D | -- | Old Republic Title Company | |
| Ulrich Lynn D | -- | Old Republic Title Company | |
| Ulrich Lynn D | -- | -- |
Source: Public Records
Mortgage History
| Date | Status | Borrower | Loan Amount |
|---|---|---|---|
| Closed | Ulrich Lynn D | $350,000 | |
| Closed | Ulrich Lynn D | $417,000 |
Source: Public Records
Tax History
| Year | Tax Paid | Tax Assessment Tax Assessment Total Assessment is a certain percentage of the fair market value that is determined by local assessors to be the total taxable value of land and additions on the property. | Land | Improvement |
|---|---|---|---|---|
| 2025 | $5,622 | $393,143 | $127,623 | $265,520 |
| 2024 | $5,622 | $385,435 | $125,121 | $260,314 |
| 2023 | $5,551 | $377,878 | $122,668 | $255,210 |
| 2022 | $5,563 | $370,469 | $120,263 | $250,206 |
| 2021 | $5,448 | $363,205 | $117,905 | $245,300 |
| 2020 | $1,976 | $359,482 | $116,697 | $242,785 |
| 2019 | $5,213 | $352,434 | $114,409 | $238,025 |
| 2018 | $5,048 | $345,524 | $112,166 | $233,358 |
| 2017 | $4,964 | $338,750 | $109,967 | $228,783 |
| 2016 | $4,667 | $332,109 | $107,811 | $224,298 |
| 2015 | $4,570 | $327,121 | $106,192 | $220,929 |
| 2014 | $4,361 | $320,714 | $104,112 | $216,602 |
Source: Public Records
Map
Nearby Homes
- 1459 Arroyo Seco Dr
- 1500 E Campbell Ave
- 61 N Leigh Ave
- 1870 Patio Dr
- 381 Manchester Ave
- 912 Campisi Way Unit 417
- 913 Apricot Ave Unit B
- 970 Apricot Ave
- 1825 Harris Ave
- 1766 Cherry Grove Dr
- 1751 Braddock Ct
- 1661 Braddock Ct
- 75 Union Ave Unit 5
- 2247 Constitution Dr
- 1776 Braddock Ct Unit 25
- 133 Union Ave Unit F
- 1898 Meridian Ave Unit 24
- 2260 Constitution Dr
- 137 Union Ave Unit A
- 1940 Huxley Ct Unit 399
- 37 Peter Ct
- 14 Peter Ct
- 38 Decorah Ln
- 1383 E Campbell Ave
- 1395 E Campbell Ave
- 14 Decorah Ln
- 49 Peter Ct
- 1375 E Campbell Ave
- 24 Peter Ct
- 1405 E Campbell Ave
- 36 Peter Ct
- 50 Decorah Ln
- 1355 E Campbell Ave
- 73 Peter Ct
- 1421 E Campbell Ave
- 1430 N Peter Dr
- 15 Decorah Ln
- 62 Decorah Ln
- 13 N Peter Dr
- 27 N Peter Dr
Your Personal Tour Guide
Ask me questions while you tour the home.