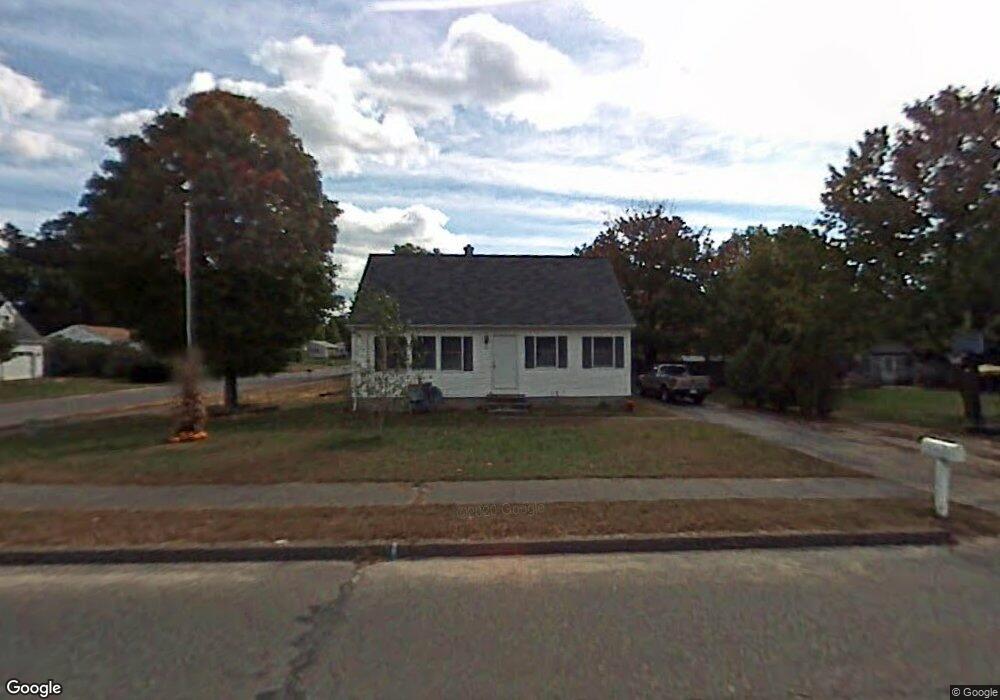
25 Rabideau Dr Easthampton, MA 01027
Estimated Value: $379,000 - $410,000
3
Beds
3
Baths
1,224
Sq Ft
$323/Sq Ft
Est. Value
About This Home
This home is located at 25 Rabideau Dr, Easthampton, MA 01027 and is currently estimated at $395,457, approximately $323 per square foot. 25 Rabideau Dr is a home located in Hampshire County with nearby schools including Easthampton High School, Hilltown Cooperative Charter Public School, and Calvary Baptist Christian School.
Ownership History
Date
Name
Owned For
Owner Type
Purchase Details
Closed on
Oct 1, 1999
Sold by
Towne Evelyn M and Towne Theodore D
Bought by
Fedora Diane D and Fedora Keith A
Current Estimated Value
Purchase Details
Closed on
Sep 13, 1999
Sold by
Citifinancial Inc
Bought by
Towne Evelyn M and Towne Theodore D
Create a Home Valuation Report for This Property
The Home Valuation Report is an in-depth analysis detailing your home's value as well as a comparison with similar homes in the area
Home Values in the Area
Average Home Value in this Area
Purchase History
| Date | Buyer | Sale Price | Title Company |
|---|---|---|---|
| Fedora Diane D | $102,000 | -- | |
| Towne Evelyn M | $89,400 | -- |
Source: Public Records
Mortgage History
| Date | Status | Borrower | Loan Amount |
|---|---|---|---|
| Open | Towne Evelyn M | $15,000 | |
| Open | Towne Evelyn M | $129,000 | |
| Closed | Towne Evelyn M | $114,750 |
Source: Public Records
Tax History Compared to Growth
Tax History
| Year | Tax Paid | Tax Assessment Tax Assessment Total Assessment is a certain percentage of the fair market value that is determined by local assessors to be the total taxable value of land and additions on the property. | Land | Improvement |
|---|---|---|---|---|
| 2025 | $4,769 | $348,900 | $118,300 | $230,600 |
| 2024 | $4,606 | $339,700 | $114,900 | $224,800 |
| 2023 | $3,626 | $247,500 | $90,400 | $157,100 |
| 2022 | $4,091 | $247,500 | $90,400 | $157,100 |
| 2021 | $4,501 | $256,600 | $90,400 | $166,200 |
| 2020 | $4,396 | $247,500 | $90,400 | $157,100 |
| 2019 | $3,560 | $230,300 | $90,400 | $139,900 |
| 2018 | $3,443 | $215,200 | $85,400 | $129,800 |
| 2017 | $3,365 | $207,600 | $82,100 | $125,500 |
| 2016 | $3,258 | $209,000 | $82,100 | $126,900 |
| 2015 | $3,166 | $209,000 | $82,100 | $126,900 |
Source: Public Records
Map
Nearby Homes