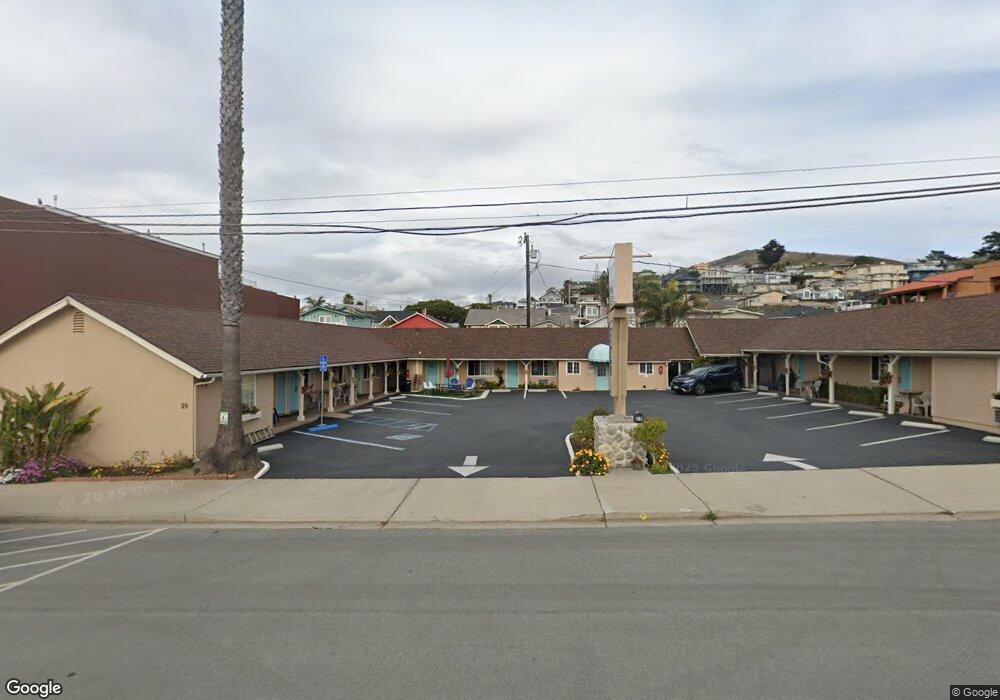
25 S Ocean Ave Unit 12 Cayucos, CA 93430
Cayucos NeighborhoodEstimated Value: $2,262,007
12
Beds
12
Baths
1,080
Sq Ft
$2,094/Sq Ft
Est. Value
About This Home
This home is located at 25 S Ocean Ave Unit 12, Cayucos, CA 93430 and is currently estimated at $2,262,007, approximately $2,094 per square foot. 25 S Ocean Ave Unit 12 is a home located in San Luis Obispo County.
Ownership History
Date
Name
Owned For
Owner Type
Purchase Details
Closed on
Jan 18, 2023
Sold by
Panchal Janak H and Panchal Kalpana J
Bought by
Mmjk Family Trust
Current Estimated Value
Purchase Details
Closed on
Jul 13, 2001
Sold by
Dunn John Michael and Dunn Edna N
Bought by
Panchal Janak M and Panchal Kalpana J
Home Financials for this Owner
Home Financials are based on the most recent Mortgage that was taken out on this home.
Original Mortgage
$624,100
Interest Rate
7.05%
Mortgage Type
Commercial
Purchase Details
Closed on
Jan 19, 1994
Sold by
Lingofelter Gary Lee and Finn Robert Dale
Bought by
Dunn John Michael and Dunn Edna N
Home Financials for this Owner
Home Financials are based on the most recent Mortgage that was taken out on this home.
Original Mortgage
$95,506
Interest Rate
7.19%
Mortgage Type
Seller Take Back
Create a Home Valuation Report for This Property
The Home Valuation Report is an in-depth analysis detailing your home's value as well as a comparison with similar homes in the area
Home Values in the Area
Average Home Value in this Area
Purchase History
| Date | Buyer | Sale Price | Title Company |
|---|---|---|---|
| Mmjk Family Trust | -- | -- | |
| Panchal Janak M | $750,000 | Chicago Title Co | |
| Dunn John Michael | $296,000 | First American Title Ins Co |
Source: Public Records
Mortgage History
| Date | Status | Borrower | Loan Amount |
|---|---|---|---|
| Previous Owner | Panchal Janak M | $624,100 | |
| Previous Owner | Dunn John Michael | $95,506 |
Source: Public Records
Tax History
| Year | Tax Paid | Tax Assessment Tax Assessment Total Assessment is a certain percentage of the fair market value that is determined by local assessors to be the total taxable value of land and additions on the property. | Land | Improvement |
|---|---|---|---|---|
| 2025 | $12,297 | $1,096,934 | $443,181 | $653,753 |
| 2024 | $12,139 | $1,075,819 | $434,492 | $641,327 |
| 2023 | $12,139 | $1,055,118 | $425,973 | $629,145 |
| 2022 | $11,918 | $1,034,822 | $417,621 | $617,201 |
| 2021 | $11,705 | $1,014,925 | $409,433 | $605,492 |
| 2020 | $11,367 | $984,724 | $405,235 | $579,489 |
| 2019 | $11,142 | $965,417 | $397,290 | $568,127 |
| 2018 | $10,917 | $946,488 | $389,500 | $556,988 |
| 2017 | $10,686 | $927,930 | $381,863 | $546,067 |
| 2016 | $10,470 | $909,736 | $374,376 | $535,360 |
| 2015 | $10,371 | $896,072 | $368,753 | $527,319 |
| 2014 | $10,025 | $878,520 | $361,530 | $516,990 |
Source: Public Records
Map
Nearby Homes
- 0 Ash Ave Unit SC25116716
- 77 N Ocean Ave Unit 8
- 77 N Ocean Ave Unit 12
- 191 J St
- 340 D St
- 31 N 3rd St
- 159 Ash Ave
- 50 S 3rd St
- 130 Cypress Ave
- 510 Park Ave
- 50 5th St
- 349 N Ocean Ave Unit A13
- 349 N Ocean Ave Unit A3
- 557 Lucerne St
- 1000 Saint Mary Ave
- 29 11th St
- 1234 Pacific Ave
- 1625 Cass Ave Unit 22
- 57 17th St
- 2023 Circle Dr
- 25 S Ocean Ave
- 30 Saint Mary Ave
- 18 Saint Mary Ave
- 26 Saint Mary Ave
- 36 Saint Mary Ave
- 32 Saint Mary Ave
- 20 Saint Mary Ave
- 41 S Ocean Ave
- 24 S Ocean Ave Unit 3
- 28 S Ocean Ave
- 32 S Ocean Ave Unit 5
- 12 Saint Mary Ave
- 40 Saint Mary Ave
- 42 Saint Mary Ave
- 15 Ocean Front Ln
- 49 S Ocean Ave
- 5 S Ocean Ave
- 14 Saint Mary Ave
- 33 Ocean Front Ln
- 26 Ocean Front Ln
Your Personal Tour Guide
Ask me questions while you tour the home.