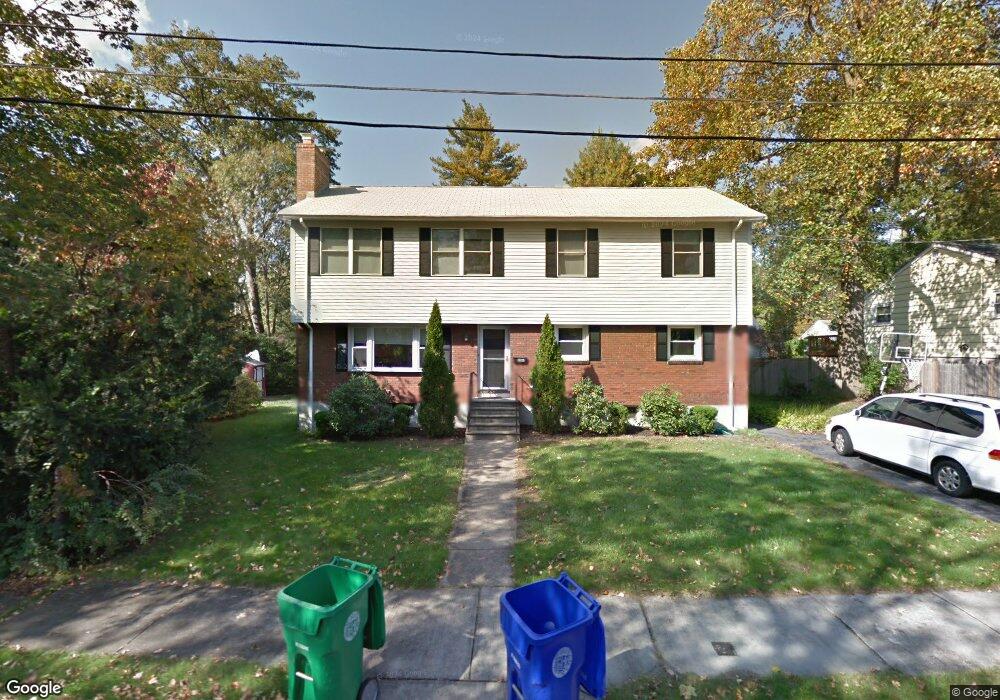
25 Sherrin Rd Newton Lower Falls, MA 02462
Newton Lower Falls NeighborhoodEstimated Value: $1,325,000 - $1,852,000
4
Beds
4
Baths
2,632
Sq Ft
$606/Sq Ft
Est. Value
About This Home
This home is located at 25 Sherrin Rd, Newton Lower Falls, MA 02462 and is currently estimated at $1,595,962, approximately $606 per square foot. 25 Sherrin Rd is a home located in Middlesex County with nearby schools including Williams Elementary School, Angier Elementary School, and Charles E Brown Middle School.
Ownership History
Date
Name
Owned For
Owner Type
Purchase Details
Closed on
Jul 15, 1996
Sold by
Wong George H and Lee Eveline H
Bought by
Elbaum Daniel and Elbaum Deborah A
Current Estimated Value
Home Financials for this Owner
Home Financials are based on the most recent Mortgage that was taken out on this home.
Original Mortgage
$209,400
Interest Rate
7.98%
Mortgage Type
Purchase Money Mortgage
Create a Home Valuation Report for This Property
The Home Valuation Report is an in-depth analysis detailing your home's value as well as a comparison with similar homes in the area
Home Values in the Area
Average Home Value in this Area
Purchase History
| Date | Buyer | Sale Price | Title Company |
|---|---|---|---|
| Elbaum Daniel | $261,750 | -- |
Source: Public Records
Mortgage History
| Date | Status | Borrower | Loan Amount |
|---|---|---|---|
| Open | Elbaum Daniel | $174,000 | |
| Closed | Elbaum Daniel | $204,800 | |
| Closed | Elbaum Daniel | $209,400 |
Source: Public Records
Tax History Compared to Growth
Tax History
| Year | Tax Paid | Tax Assessment Tax Assessment Total Assessment is a certain percentage of the fair market value that is determined by local assessors to be the total taxable value of land and additions on the property. | Land | Improvement |
|---|---|---|---|---|
| 2025 | $14,980 | $1,528,600 | $829,500 | $699,100 |
| 2024 | $14,485 | $1,484,100 | $805,300 | $678,800 |
| 2023 | $13,840 | $1,359,500 | $621,500 | $738,000 |
| 2022 | $13,243 | $1,258,800 | $575,500 | $683,300 |
| 2021 | $7,449 | $1,187,500 | $542,900 | $644,600 |
| 2020 | $12,398 | $1,187,500 | $542,900 | $644,600 |
| 2019 | $12,048 | $1,152,900 | $527,100 | $625,800 |
| 2018 | $6,776 | $1,053,600 | $474,500 | $579,100 |
| 2017 | $11,053 | $994,000 | $447,600 | $546,400 |
| 2016 | $10,385 | $912,600 | $418,300 | $494,300 |
| 2015 | $9,902 | $852,900 | $390,900 | $462,000 |
Source: Public Records
Map
Nearby Homes
- 17 Deforest Rd
- 45 Moulton St
- 25 Columbia St
- 2084 Washington St
- 27 Oakwood Rd
- 45 E Quinobequin Rd
- 7 Crescent St
- 34 Palmer Rd
- 17 Lasell St
- 41 Orchard Ave
- 10 Lorraine Cir
- 177 Varick Rd
- 135 Orchard Ave
- 8 Old Town Rd
- 2 Longfellow Rd
- 2202 Commonwealth Ave Unit 2
- 2202 Commonwealth Ave Unit 1
- 33 Metacomet Rd
- 283 Woodland Rd
- 1754 Washington St