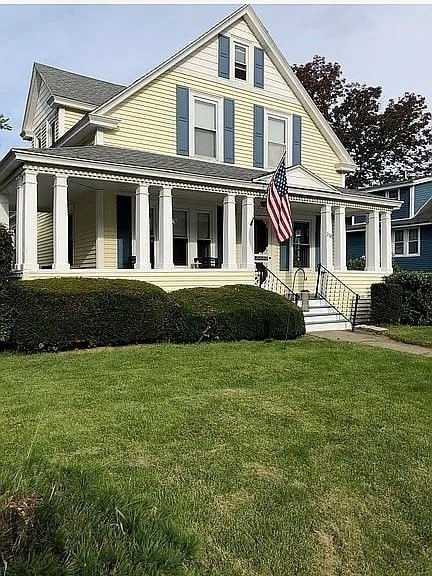


250 May St Worcester, MA 01602
Newton Square NeighborhoodEstimated payment $3,067/month
Highlights
- Colonial Architecture
- Property is near public transit
- Corner Lot
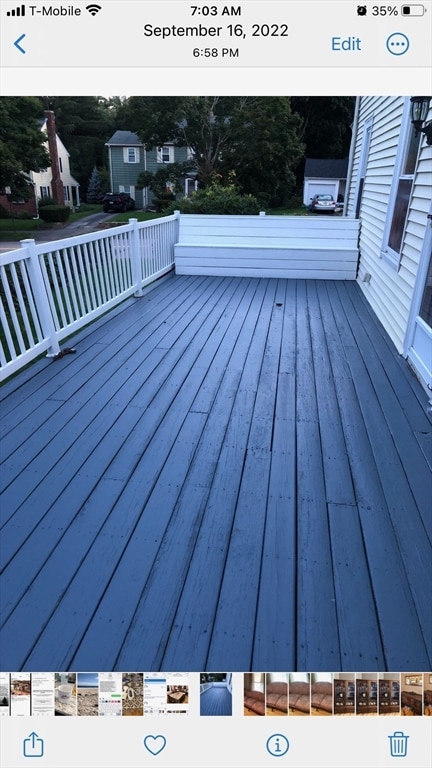
- Deck
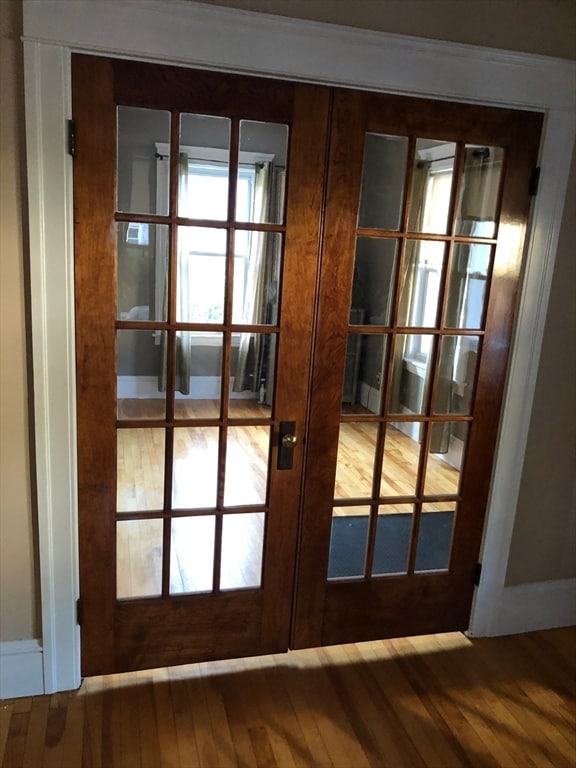
- Wood Flooring
- No HOA
About This Home
Beautiful move in ready property in a desirable neighborhood. This home boasts great outdoor space, with a front porch, back deck and plenty of yard space. Hardwood floors and gleaming woodwork throughout this home. This home has great character, just add your touches to make it home.
Home Details
Home Type
- Single Family
Est. Annual Taxes
- $4,919
Year Built
- Built in 1917
Lot Details
- 7,064 Sq Ft Lot
- Near Conservation Area
- Corner Lot
- Property is zoned RL-7
Home Design
- Colonial Architecture
- Frame Construction
- Blown-In Insulation
- Shingle Roof
- Vertical Siding
- Concrete Perimeter Foundation
Interior Spaces
- Insulated Windows
- French Doors
- Insulated Doors
- Wood Flooring
- Home Security System
Kitchen
- Range with Range Hood
- Microwave
- Plumbed For Ice Maker
- Dishwasher
- Disposal
Bedrooms and Bathrooms
- 3 Bedrooms
Laundry
- Dryer
- Washer
Partially Finished Basement
- Walk-Out Basement
- Basement Fills Entire Space Under The House
- Block Basement Construction
Parking
- 4 Car Parking Spaces
- Driveway
- Paved Parking
- Open Parking
- Off-Street Parking
Outdoor Features
- Deck
- Outdoor Storage
- Rain Gutters
- Porch
Location
- Property is near public transit
- Property is near schools
Utilities
- No Cooling
- Heating System Uses Natural Gas
- Hot Water Heating System
- Heating System Uses Steam
- Gas Water Heater
Listing and Financial Details
- Assessor Parcel Number M:24 B:036 L:00018,1785477
Community Details
Recreation
- Park
Additional Features
- No Home Owners Association
- Shops
Map
Home Values in the Area
Average Home Value in this Area
Tax History
| Year | Tax Paid | Tax Assessment Tax Assessment Total Assessment is a certain percentage of the fair market value that is determined by local assessors to be the total taxable value of land and additions on the property. | Land | Improvement |
|---|---|---|---|---|
| 2025 | $4,919 | $372,900 | $117,600 | $255,300 |
| 2024 | $4,716 | $343,000 | $117,600 | $225,400 |
| 2023 | $4,523 | $315,400 | $102,200 | $213,200 |
| 2022 | $4,155 | $273,200 | $81,800 | $191,400 |
| 2021 | $4,042 | $248,300 | $65,400 | $182,900 |
| 2020 | $3,851 | $226,500 | $65,400 | $161,100 |
| 2019 | $3,695 | $205,300 | $58,800 | $146,500 |
| 2018 | $3,682 | $194,700 | $58,800 | $135,900 |
| 2017 | $3,525 | $183,400 | $58,800 | $124,600 |
| 2016 | $3,473 | $168,500 | $42,700 | $125,800 |
| 2015 | $3,382 | $168,500 | $42,700 | $125,800 |
| 2014 | $3,292 | $168,500 | $42,700 | $125,800 |
Property History
| Date | Event | Price | List to Sale | Price per Sq Ft |
|---|---|---|---|---|
| 11/06/2025 11/06/25 | Price Changed | $505,000 | -3.8% | $316 / Sq Ft |
| 10/21/2025 10/21/25 | Price Changed | $524,900 | -4.4% | $328 / Sq Ft |
| 10/13/2025 10/13/25 | For Sale | $549,000 | -- | $343 / Sq Ft |
Purchase History
| Date | Type | Sale Price | Title Company |
|---|---|---|---|
| Quit Claim Deed | -- | -- | |
| Deed | $110,000 | -- |
Mortgage History
| Date | Status | Loan Amount | Loan Type |
|---|---|---|---|
| Previous Owner | $157,500 | No Value Available | |
| Previous Owner | $129,000 | No Value Available | |
| Previous Owner | $109,150 | No Value Available | |
| Previous Owner | $110,400 | Purchase Money Mortgage |
Source: MLS Property Information Network (MLS PIN)
MLS Number: 73442976
APN: WORC-000024-000036-000018
Disclaimer: Certain information contained herein is derived from information provided by parties other than Homes.com. All information provided is deemed reliable, but is not guaranteed to be accurate and should be independently verified.
![]() The property listing data and information, or the Images, set forth herein were provided to MLS Property Information Network, Inc. from third party sources, including sellers, lessors and public records, and were compiled by MLS Property Information Network, Inc. The property listing data and information, and the Images, are for the personal, non-commercial use of consumers having a good faith interest in purchasing or leasing listed properties of the type displayed to them and may not be used for any purpose other than to identify prospective properties which such consumers may have a good faith interest in purchasing or leasing. MLS Property Information Network, Inc. and its subscribers disclaim any and all representations and warranties as to the accuracy of the property listing data and information, or as to the accuracy of any of the Images, set forth herein.
The property listing data and information, or the Images, set forth herein were provided to MLS Property Information Network, Inc. from third party sources, including sellers, lessors and public records, and were compiled by MLS Property Information Network, Inc. The property listing data and information, and the Images, are for the personal, non-commercial use of consumers having a good faith interest in purchasing or leasing listed properties of the type displayed to them and may not be used for any purpose other than to identify prospective properties which such consumers may have a good faith interest in purchasing or leasing. MLS Property Information Network, Inc. and its subscribers disclaim any and all representations and warranties as to the accuracy of the property listing data and information, or as to the accuracy of any of the Images, set forth herein.
- 18 Zenith Dr
- 16 Sherwood Rd
- 2 Carlisle St
- 96 June St Unit 3
- 41 Walnut Hill Dr
- 371 Chandler St Unit 2
- 53 Howland Terrace
- 40 Howland Terrace
- 346 Lovell St
- 71 Glendale St
- 62 Circuit Ave N
- 83 Commodore Rd
- 10 Minthorne St
- 4 Longfellow Rd
- 563 Chandler St
- 1 Clive St
- 19 Kenilworth Rd
- 5 Lisbon St
- 415 Mill St
- 9 Field Way
- 5 Sherwood Rd
- 6 Woodman Rd Unit 2
- 99 June St Unit 3
- 42 June St Unit june st
- 552 Chandler St Unit 2
- 6 Richmond Ave Unit 2
- 9 Englewood Ave Unit Rooms
- 22-24 Ferdinand St Unit 2
- 929 Pleasant St Unit 2
- 121 Winfield St Unit 3
- 19 Brantwood Rd Unit 2
- 488 Park Ave Unit 1
- 284 Highland St Unit 3
- 543 Park Ave Unit 3
- 144 Elm St
- 44 Bellevue St Unit 3
- 44 Bellevue St Unit 1
- 39 Florence St Unit 2
- 36 Townsend St
- 11 Clifton St
