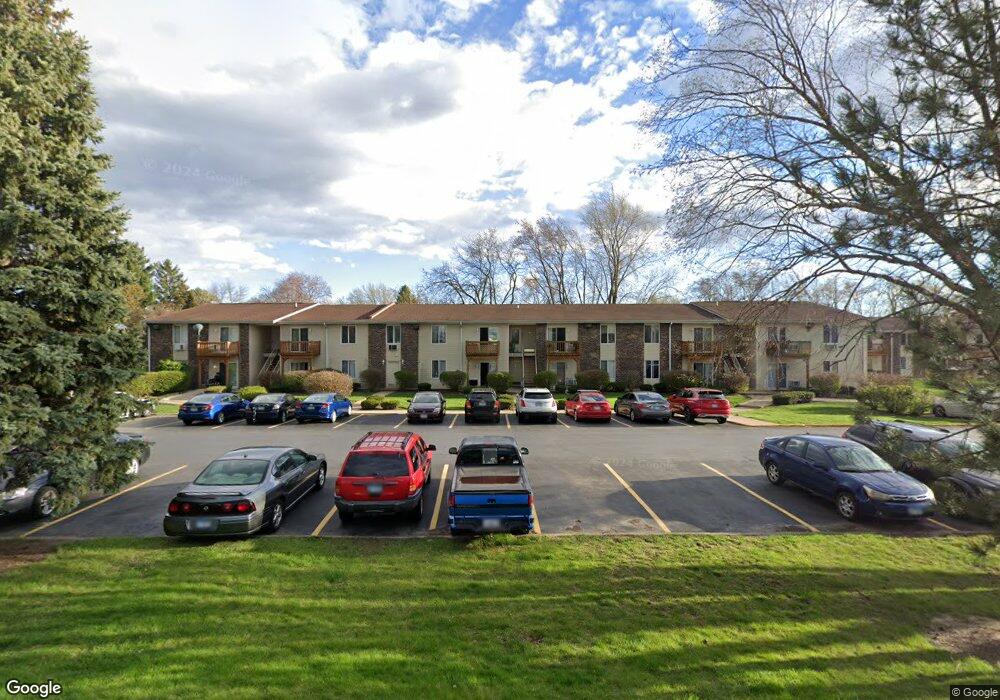
2500 Light Rd Unit 204 Oswego, IL 60543
Northwest Oswego NeighborhoodEstimated Value: $121,000 - $128,000
1
Bed
1
Bath
571
Sq Ft
$220/Sq Ft
Est. Value
About This Home
This home is located at 2500 Light Rd Unit 204, Oswego, IL 60543 and is currently estimated at $125,370, approximately $219 per square foot. 2500 Light Rd Unit 204 is a home located in Kendall County with nearby schools including Fox Chase Elementary School, Traughber Junior High School, and Oswego High School.
Ownership History
Date
Name
Owned For
Owner Type
Purchase Details
Closed on
Jan 9, 2004
Sold by
Oconnor David B and Oconnor Christine A
Bought by
Lorenzi Ronald M
Current Estimated Value
Home Financials for this Owner
Home Financials are based on the most recent Mortgage that was taken out on this home.
Original Mortgage
$49,000
Outstanding Balance
$22,931
Interest Rate
5.91%
Mortgage Type
FHA
Estimated Equity
$102,439
Purchase Details
Closed on
Nov 7, 2001
Sold by
Lowery Kevin C and Lowery Traci A
Bought by
Oconnor David B and Oconnor Christine A
Purchase Details
Closed on
Oct 17, 1996
Sold by
American National Bk&Tr Co Of Chicago
Bought by
Lowery Kevin C
Home Financials for this Owner
Home Financials are based on the most recent Mortgage that was taken out on this home.
Original Mortgage
$47,550
Interest Rate
8.23%
Mortgage Type
FHA
Create a Home Valuation Report for This Property
The Home Valuation Report is an in-depth analysis detailing your home's value as well as a comparison with similar homes in the area
Home Values in the Area
Average Home Value in this Area
Purchase History
| Date | Buyer | Sale Price | Title Company |
|---|---|---|---|
| Lorenzi Ronald M | $59,000 | First American Title Ins Co | |
| Oconnor David B | $57,000 | -- | |
| Lowery Kevin C | $48,500 | Chicago Title Insurance Co |
Source: Public Records
Mortgage History
| Date | Status | Borrower | Loan Amount |
|---|---|---|---|
| Open | Lorenzi Ronald M | $49,000 | |
| Previous Owner | Lowery Kevin C | $47,550 |
Source: Public Records
Tax History Compared to Growth
Tax History
| Year | Tax Paid | Tax Assessment Tax Assessment Total Assessment is a certain percentage of the fair market value that is determined by local assessors to be the total taxable value of land and additions on the property. | Land | Improvement |
|---|---|---|---|---|
| 2024 | $989 | $33,599 | $2,231 | $31,368 |
| 2023 | $1,554 | $25,845 | $1,716 | $24,129 |
| 2022 | $1,554 | $23,495 | $1,560 | $21,935 |
| 2021 | $1,508 | $22,376 | $1,486 | $20,890 |
| 2020 | $1,443 | $21,516 | $1,429 | $20,087 |
| 2019 | $1,411 | $20,931 | $1,429 | $19,502 |
| 2018 | $570 | $12,205 | $833 | $11,372 |
| 2017 | $530 | $11,249 | $768 | $10,481 |
| 2016 | $433 | $10,226 | $698 | $9,528 |
| 2015 | $328 | $9,050 | $618 | $8,432 |
| 2014 | -- | $8,538 | $583 | $7,955 |
| 2013 | -- | $10,045 | $686 | $9,359 |
Source: Public Records
Map
Nearby Homes
- 2100 Light Rd Unit 109
- 7.43 Acres Vacant La State Route 31
- 11-13 W Anchor Rd
- 5.43 B-3 Commercial State Route 31
- 1721 State Route 31
- Parcel 004 & 003 Illinois 25
- 173 Dolores St
- 102 Mary St
- 133 River Mist Dr Unit 3
- 156 River Mist Dr
- 409 Fawn Dr
- 2110 State Route 31
- 608 Clearwater Ct
- 602 Clearwater Ct Unit 2
- 119 Garden Dr
- 3 Scarsdale Rd
- 403 Lake Ct
- 435 Fawn Dr
- 117 Boulder Hill Pass Unit 117
- 30 Fieldpoint Rd
- 2500 Light Rd Unit 201
- 2500 Light Rd Unit 208
- 2500 Light Rd Unit 112
- 2500 Light Rd Unit 212
- 2500 Light Rd Unit 211
- 2500 Light Rd Unit 107
- 2500 Light Rd Unit 104
- 2500 Light Rd Unit 210
- 2500 Light Rd Unit 102
- 2500 Light Rd Unit 111
- 2500 Light Rd Unit 209
- 2500 Light Rd Unit 108
- 2500 Light Rd Unit 207
- 2500 Light Rd Unit 101
- 2500 Light Rd Unit 203
- 2500 Light Rd Unit 206
- 2500 Light Rd Unit 103
- 2500 Light Rd Unit 205
- 2500 Light Rd Unit 109
- 2500 Light Rd Unit 202