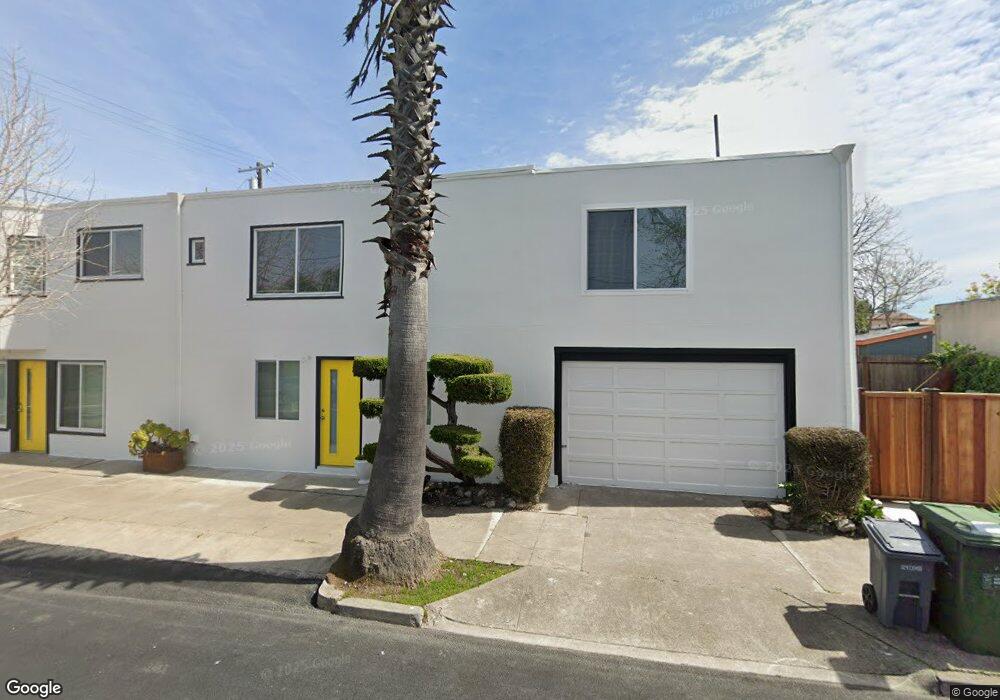
2501 Mabel St Berkeley, CA 94702
West Berkeley NeighborhoodEstimated Value: $1,322,000 - $1,512,000
2
Beds
1
Bath
2,317
Sq Ft
$624/Sq Ft
Est. Value
About This Home
This home is located at 2501 Mabel St, Berkeley, CA 94702 and is currently estimated at $1,446,768, approximately $624 per square foot. 2501 Mabel St is a home located in Alameda County with nearby schools including Oxford Elementary School, Washington Elementary School, and Malcolm X Elementary School.
Ownership History
Date
Name
Owned For
Owner Type
Purchase Details
Closed on
Apr 13, 2021
Sold by
Singh Narinderpal and Kaur Surinder
Bought by
Singh Narinderpal and Kaur Surinder
Current Estimated Value
Purchase Details
Closed on
Oct 26, 2018
Sold by
Kaur Daljit and Kaur Surinder
Bought by
Kaur Daljit and Kaur Suringer
Home Financials for this Owner
Home Financials are based on the most recent Mortgage that was taken out on this home.
Original Mortgage
$190,000
Interest Rate
4.6%
Mortgage Type
Commercial
Purchase Details
Closed on
May 3, 2016
Sold by
Singh Narinder Pal
Bought by
Kaur Surinder
Purchase Details
Closed on
Aug 1, 2013
Sold by
Sharma Nidhi
Bought by
Kaur Daljit
Purchase Details
Closed on
Nov 10, 2011
Sold by
Kaur Randhir
Bought by
Sharma Nidhi
Home Financials for this Owner
Home Financials are based on the most recent Mortgage that was taken out on this home.
Original Mortgage
$352,000
Interest Rate
3.94%
Mortgage Type
Purchase Money Mortgage
Purchase Details
Closed on
Jul 2, 2009
Sold by
Chalal Gurcharan Singh
Bought by
Kaur Randhir
Purchase Details
Closed on
Aug 4, 2006
Sold by
Chahal Gurcharan Singh and Kaur Randhir
Bought by
Chahal Gurcharan Singh and Kaur Randhir
Home Financials for this Owner
Home Financials are based on the most recent Mortgage that was taken out on this home.
Original Mortgage
$476,000
Interest Rate
6.62%
Mortgage Type
Purchase Money Mortgage
Purchase Details
Closed on
Nov 19, 2004
Sold by
Kaur Randhir
Bought by
Singhchahal Gurcharan and Kaur Randhir
Home Financials for this Owner
Home Financials are based on the most recent Mortgage that was taken out on this home.
Original Mortgage
$468,000
Interest Rate
6.99%
Mortgage Type
Purchase Money Mortgage
Purchase Details
Closed on
Oct 21, 2004
Sold by
Kelly Milton Leo and Kelly Shirley Mary
Bought by
Kaur Randhir
Home Financials for this Owner
Home Financials are based on the most recent Mortgage that was taken out on this home.
Original Mortgage
$468,000
Interest Rate
6.99%
Mortgage Type
Purchase Money Mortgage
Purchase Details
Closed on
Aug 24, 1999
Sold by
Kelly Milton L
Bought by
Kelly Milton Leo and Kelly Shirley Mary
Create a Home Valuation Report for This Property
The Home Valuation Report is an in-depth analysis detailing your home's value as well as a comparison with similar homes in the area
Home Values in the Area
Average Home Value in this Area
Purchase History
| Date | Buyer | Sale Price | Title Company |
|---|---|---|---|
| Singh Narinderpal | -- | None Available | |
| Singh Narinderpal | -- | None Available | |
| Kaur Surinder | -- | None Available | |
| Kaur Daljit | -- | Chicago Title | |
| Kaur Surinder | -- | Accommodation | |
| Kaur Daljit | -- | Accommodation | |
| Kaur Daljit | -- | None Available | |
| Sharma Nidhi | $440,000 | North American Title Company | |
| Kaur Randhir | -- | None Available | |
| Chahal Gurcharan Singh | -- | Stewart Title Of California | |
| Singhchahal Gurcharan | -- | -- | |
| Kaur Randhir | $520,000 | Chicago Title Co | |
| Kelly Milton Leo | -- | -- |
Source: Public Records
Mortgage History
| Date | Status | Borrower | Loan Amount |
|---|---|---|---|
| Previous Owner | Kaur Daljit | $190,000 | |
| Previous Owner | Sharma Nidhi | $352,000 | |
| Previous Owner | Chahal Gurcharan Singh | $476,000 | |
| Previous Owner | Kaur Randhir | $468,000 |
Source: Public Records
Tax History
| Year | Tax Paid | Tax Assessment Tax Assessment Total Assessment is a certain percentage of the fair market value that is determined by local assessors to be the total taxable value of land and additions on the property. | Land | Improvement |
|---|---|---|---|---|
| 2025 | $22,786 | $770,454 | $205,936 | $571,518 |
| 2024 | $22,786 | $1,480,080 | $445,704 | $1,039,976 |
| 2023 | $22,249 | $1,456,560 | $436,968 | $1,019,592 |
| 2022 | $12,354 | $646,867 | $194,060 | $452,807 |
| 2021 | $12,349 | $634,188 | $190,256 | $443,932 |
| 2020 | $11,518 | $627,687 | $188,306 | $439,381 |
| 2019 | $10,886 | $615,383 | $184,615 | $430,768 |
| 2018 | $10,670 | $603,321 | $180,996 | $422,325 |
| 2017 | $10,293 | $591,494 | $177,448 | $414,046 |
| 2016 | $9,848 | $579,896 | $173,969 | $405,927 |
| 2015 | $9,700 | $571,188 | $171,356 | $399,832 |
| 2014 | $9,589 | $560,000 | $168,000 | $392,000 |
Source: Public Records
Map
Nearby Homes
- 1142 Dwight Way
- 1118 Dwight Way
- 1092 Dwight Way
- 2324 Browning St
- 1515 Derby St
- 2350 Sacramento St
- 1450 Ward St
- 2750 Sacramento St
- 2751 Wallace St
- 2758 Sacramento St
- 2747 San Pablo Ave Unit 507
- 2774 Sacramento St
- 1039 Channing Way
- 2782 Sacramento St
- 2790 Sacramento St
- 1034 Grayson St
- 2327 10th St Unit 4
- 1612 Parker St
- 1612 Carleton St
- 2231 Byron St
- 2501 Mabel St Unit B
- 1304 Dwight Way
- 1306 Dwight Way
- 2511 Mabel St
- 1240 Dwight Way
- 2515 Mabel St
- 1308 Dwight Way
- 1236 Dwight Way
- 1310 Dwight Way
- 2510 Mabel St
- 1301 Blake St
- 1305 Blake St
- 2514 Mabel St
- 1314 Dwight Way
- 1307 Blake St
- 1307 Dwight Way
- 1232 Dwight Way
- 1309 Blake St
- 1327 Dwight Way
- 1239 Blake St
Your Personal Tour Guide
Ask me questions while you tour the home.