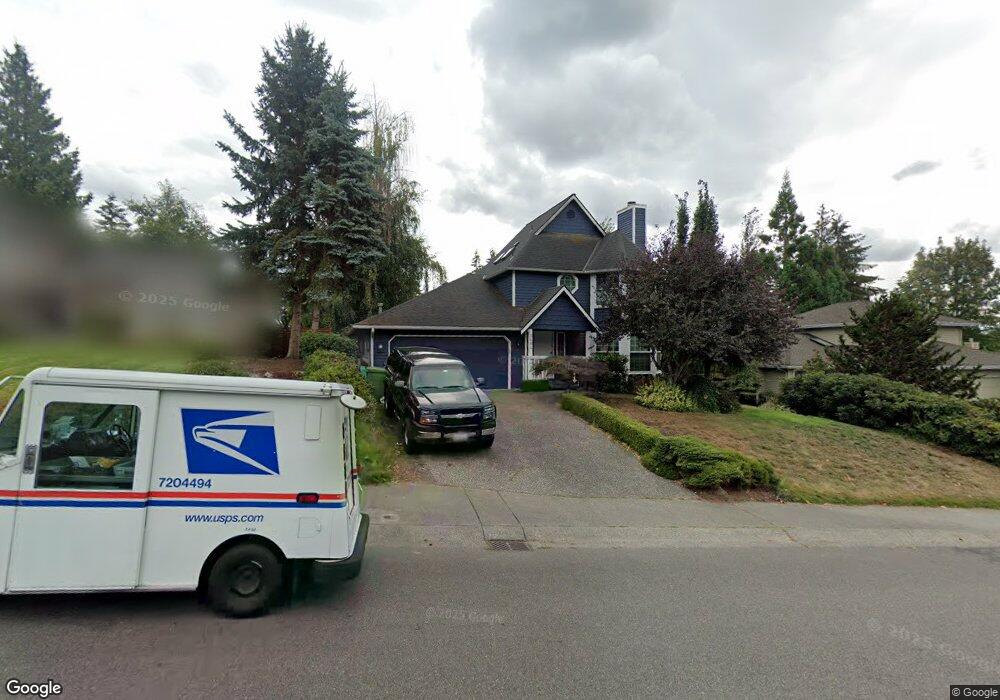
2502 184th Place SE Bothell, WA 98012
North Creek NeighborhoodEstimated Value: $861,000 - $1,066,000
3
Beds
3
Baths
1,854
Sq Ft
$525/Sq Ft
Est. Value
About This Home
This home is located at 2502 184th Place SE, Bothell, WA 98012 and is currently estimated at $974,022, approximately $525 per square foot. 2502 184th Place SE is a home located in Snohomish County with nearby schools including Crystal Springs Elementary School, Skyview Middle School, and North Creek High School.
Ownership History
Date
Name
Owned For
Owner Type
Purchase Details
Closed on
Mar 17, 2003
Sold by
Johnson Kaelin R
Bought by
Shelton Chandler Y and Shelton Jennifer L
Current Estimated Value
Home Financials for this Owner
Home Financials are based on the most recent Mortgage that was taken out on this home.
Original Mortgage
$208,000
Outstanding Balance
$84,221
Interest Rate
5.82%
Estimated Equity
$889,801
Purchase Details
Closed on
Feb 26, 2002
Sold by
Johnson Mark W
Bought by
Johnson Kaelin R
Purchase Details
Closed on
Dec 21, 1993
Sold by
Houvener Paul R and Houvener Gale A
Bought by
Johnson Mark W and Johnson Kaelin R
Home Financials for this Owner
Home Financials are based on the most recent Mortgage that was taken out on this home.
Original Mortgage
$120,000
Interest Rate
7.2%
Create a Home Valuation Report for This Property
The Home Valuation Report is an in-depth analysis detailing your home's value as well as a comparison with similar homes in the area
Home Values in the Area
Average Home Value in this Area
Purchase History
| Date | Buyer | Sale Price | Title Company |
|---|---|---|---|
| Shelton Chandler Y | $260,000 | Fidelity National Title | |
| Johnson Kaelin R | -- | Chicago Title Insurance Co | |
| Johnson Mark W | $150,000 | Charter Title |
Source: Public Records
Mortgage History
| Date | Status | Borrower | Loan Amount |
|---|---|---|---|
| Open | Shelton Chandler Y | $208,000 | |
| Previous Owner | Johnson Mark W | $120,000 | |
| Closed | Shelton Chandler Y | $25,950 |
Source: Public Records
Tax History
| Year | Tax Paid | Tax Assessment Tax Assessment Total Assessment is a certain percentage of the fair market value that is determined by local assessors to be the total taxable value of land and additions on the property. | Land | Improvement |
|---|---|---|---|---|
| 2026 | $7,760 | $964,600 | $695,000 | $269,600 |
| 2025 | $7,185 | $862,800 | $600,000 | $262,800 |
| 2024 | $7,185 | $798,700 | $545,000 | $253,700 |
| 2023 | $8,491 | $1,055,700 | $765,000 | $290,700 |
| 2022 | $7,360 | $726,800 | $480,000 | $246,800 |
| 2020 | $6,528 | $607,800 | $369,000 | $238,800 |
| 2019 | $5,858 | $551,300 | $315,000 | $236,300 |
| 2018 | $5,433 | $475,800 | $265,000 | $210,800 |
| 2017 | $4,638 | $412,700 | $215,000 | $197,700 |
| 2016 | $4,239 | $367,500 | $180,000 | $187,500 |
| 2015 | $4,279 | $352,700 | $170,000 | $182,700 |
| 2013 | $3,729 | $272,900 | $145,000 | $127,900 |
Source: Public Records
Map
Nearby Homes
- 2401 185th Place SE
- 18309 26th Dr SE
- 18501 28th Ave SE
- 18429 20th Dr SE
- 18632 29th Ave SE
- 3028 183rd Place SE
- 18809 20th Dr SE
- 18223 31st Ave SE
- 19102 20th Dr SE Unit B204
- 19102 20th Dr SE Unit B202
- 19102 20th Dr SE Unit B206
- 19218 26th Ave SE Unit 117
- 3205 179th Place SE
- 17529 Brook Blvd
- 3125 194th St SE
- 18910 Bothell Everett Hwy Unit H2
- 18910 Bothell Everett Hwy Unit N2
- 18930 Bothell Everett Hwy Unit B-103
- 18930 Bothell Everett Hwy Unit G103
- 18930 Bothell Everett Hwy Unit G105
- 2428 184th Place SE
- 2510 184th Place SE
- 18511 26th Ave SE
- 18507 26th Ave SE
- 2420 184th Place SE
- 2516 184th Place SE
- 18515 26th Ave SE
- 2620 186th Place SE
- 16412 (Lot 38) 1st Park SE
- 205 Lot 108 164th Place SE
- 18519 26th Ave SE
- 2503 184th Place SE
- 2431 184th Place SE
- 2509 184th Place SE
- 2412 184th Place SE
- 2526 184th Place SE
- 2423 184th Place SE
- 2515 184th Place SE
- 18523 26th Ave SE
- 2417 184th Place SE
Your Personal Tour Guide
Ask me questions while you tour the home.