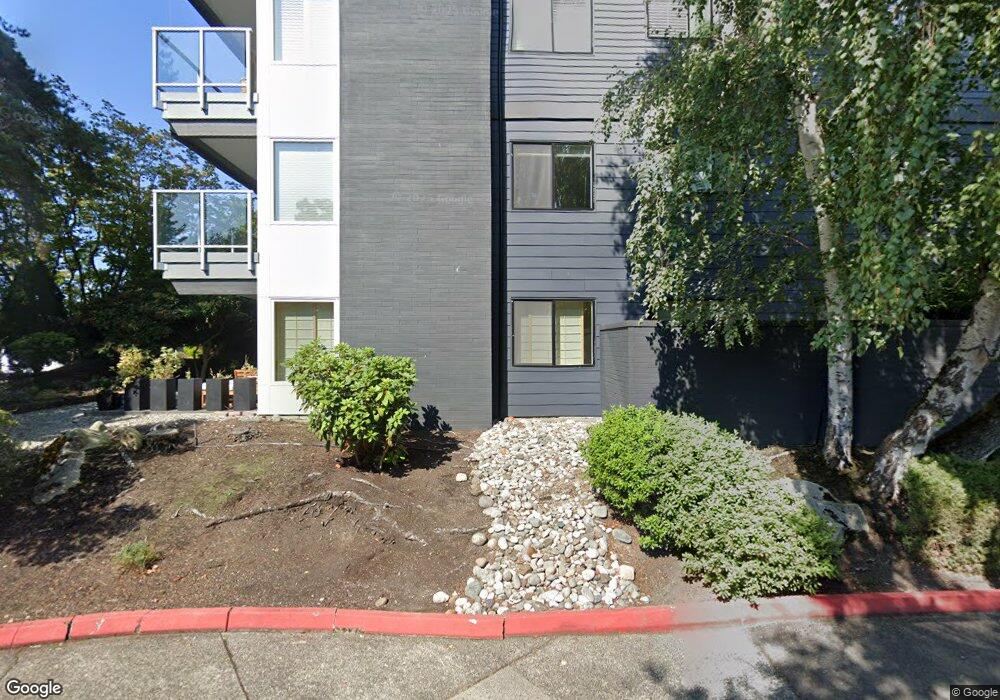
2502 Canterbury Ln E Unit 409 Seattle, WA 98112
Madison Park NeighborhoodEstimated Value: $816,000 - $1,145,000
2
Beds
2
Baths
1,346
Sq Ft
$713/Sq Ft
Est. Value
About This Home
This home is located at 2502 Canterbury Ln E Unit 409, Seattle, WA 98112 and is currently estimated at $959,793, approximately $713 per square foot. 2502 Canterbury Ln E Unit 409 is a home located in King County with nearby schools including McGilvra Elementary School, Meany Middle School, and Garfield High School.
Ownership History
Date
Name
Owned For
Owner Type
Purchase Details
Closed on
Dec 12, 2023
Sold by
Gae E Burr Living Trust
Bought by
Burr Corinne
Current Estimated Value
Purchase Details
Closed on
Jun 9, 2017
Sold by
Burr Gae E
Bought by
Burr Gae E and Burr Corinne E
Purchase Details
Closed on
Mar 30, 2011
Sold by
Burr Gae E
Bought by
Burr Gae E
Purchase Details
Closed on
Mar 20, 2000
Sold by
Malcomson William L and Malcomson Laurel L
Bought by
Burr Gae E
Purchase Details
Closed on
Nov 19, 1999
Sold by
Malcomson William and Malcomson Laurel L
Bought by
Malcomson William L and Malcomson Laurel L
Purchase Details
Closed on
Jul 2, 1998
Sold by
Mondschein Lawrence D
Bought by
Malcomson William and Malcomson Laurel L
Purchase Details
Closed on
Jul 1, 1998
Sold by
Mondschein Lawrence D and Sarkowsky Faye
Bought by
Mondschein Lawrence D
Create a Home Valuation Report for This Property
The Home Valuation Report is an in-depth analysis detailing your home's value as well as a comparison with similar homes in the area
Home Values in the Area
Average Home Value in this Area
Purchase History
| Date | Buyer | Sale Price | Title Company |
|---|---|---|---|
| Burr Corinne | $313 | None Listed On Document | |
| Burr Gae E | -- | None Available | |
| Burr Gae E | -- | None Available | |
| Burr Gae E | $344,000 | Fidelity National Title | |
| Malcomson William L | -- | -- | |
| Malcomson William | $265,000 | Fidelity National Title Co | |
| Mondschein Lawrence D | -- | -- |
Source: Public Records
Tax History Compared to Growth
Tax History
| Year | Tax Paid | Tax Assessment Tax Assessment Total Assessment is a certain percentage of the fair market value that is determined by local assessors to be the total taxable value of land and additions on the property. | Land | Improvement |
|---|---|---|---|---|
| 2024 | $8,839 | $935,000 | $672,400 | $262,600 |
| 2023 | $6,649 | $959,000 | $672,400 | $286,600 |
| 2022 | $6,635 | $793,000 | $433,300 | $359,700 |
| 2021 | $6,927 | $729,000 | $433,300 | $295,700 |
| 2020 | $6,995 | $724,000 | $421,900 | $302,100 |
| 2018 | $6,404 | $765,000 | $376,300 | $388,700 |
| 2017 | $5,723 | $654,000 | $330,700 | $323,300 |
| 2016 | $5,723 | $604,000 | $296,500 | $307,500 |
| 2015 | $5,299 | $590,000 | $296,500 | $293,500 |
| 2014 | -- | $559,000 | $291,500 | $267,500 |
| 2013 | -- | $437,000 | $291,500 | $145,500 |
Source: Public Records
Map
Nearby Homes
- 2501 Canterbury Ln E Unit 106
- 2501 Canterbury Ln E Unit 221
- 2502 Canterbury Ln E Unit 406
- 2500 Canterbury Ln E Unit 302
- 2538 39th Ave E Unit 6
- 2540 39th Ave E Unit 5
- 2360 43rd Ave E Unit 211
- 2360 43rd Ave E Unit 404
- 2360 43rd Ave E Unit 214
- 2320 43rd Ave E Unit 15A
- 2031 42nd Ave E
- 2040 43rd Ave E Unit 402
- 2105 38th Ave E
- 1929 42nd Ave E Unit B
- 1960 Shenandoah Dr E
- 2001 Broadmoor Dr E
- 1994 Shenandoah Dr E
- 3038 E Laurelhurst Dr NE
- 1616 41st Ave E Unit 301
- 1615 39th Ave E
- 2502 Canterbury Ln E Unit 211
- 2502 Canterbury Ln E Unit 314
- 2502 Canterbury Ln E Unit 212
- 2502 Canterbury Ln E Unit 410
- 2502 Canterbury Ln E Unit 308
- 2502 Canterbury Ln E Unit 207
- 2502 Canterbury Ln E Unit 407
- 2502 Canterbury Ln E Unit 407-0
- 2502 Canterbury Ln E Unit 413
- 2502 Canterbury Ln E
- 2502 Canterbury Ln E Unit 411
- 2502 Canterbury Ln E Unit 112
- 2501 Canterbury Ln E Unit 116
- 2501 Canterbury Ln E Unit 223
- 2501 Canterbury Ln E Unit 413
- 2501 Canterbury Ln E Unit 321
- 2501 Canterbury Ln E Unit 320
- 2501 Canterbury Ln E Unit 217
- 2501 Canterbury Ln E Unit 123
- 2501 Canterbury Ln E Unit 110