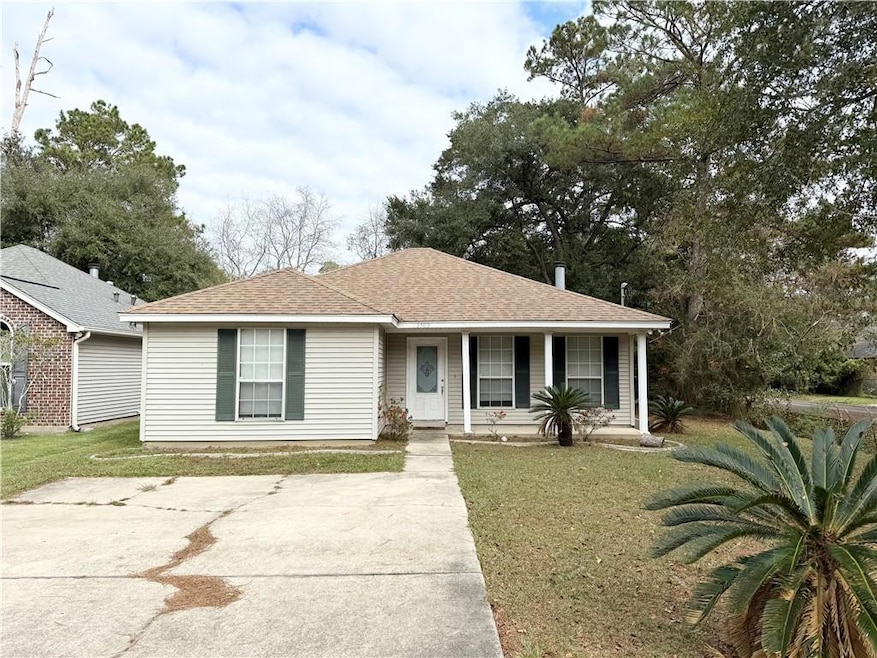
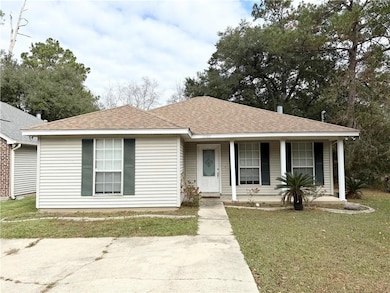
2502 Mallard St Slidell, LA 70460
Estimated payment $1,021/month
Highlights
- Covered Patio or Porch
- Central Heating and Cooling System
- Property is in very good condition
- Soaking Tub
- Ceiling Fan
- Rectangular Lot
About This Home
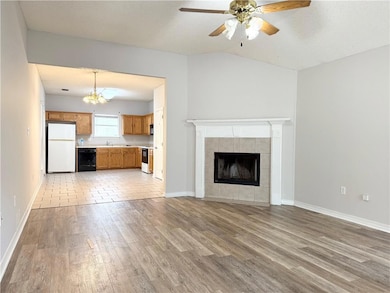
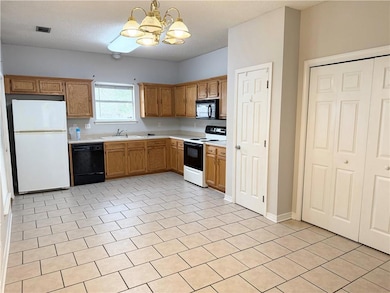
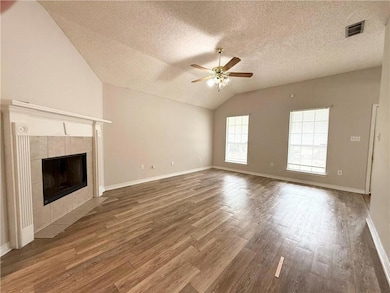
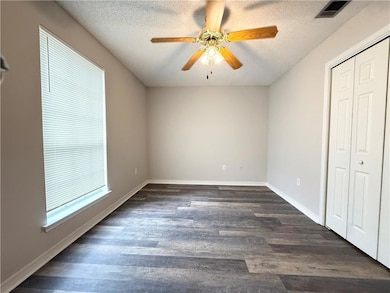
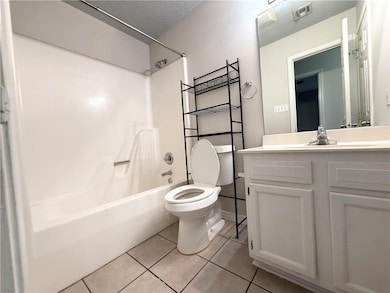
Welcome to this charming 3-bedroom, 2-bath home featuring an open floor plan and a prime corner lot location. Just minutes from I-12, restaurants, and shopping centers, this home offers both comfort and convenience. Freshly painted with newer laminate floors, it’s truly move-in ready. The inviting living room boasts a wood-burning fireplace and flows seamlessly into the spacious kitchen, perfect for everyday living and entertaining. The Primary Suite features a lovely tray ceiling, while the ensuite bath includes a relaxing garden tub. Step outside to a very large fenced backyard complete with a covered patio, ideal for outdoor dining, gatherings, or play. Also for lease.
Home Details
Home Type
- Single Family
Year Built
- Built in 2003
Lot Details
- Lot Dimensions are 50x135
- Fenced
- Rectangular Lot
- Property is in very good condition
Home Design
- Slab Foundation
- Shingle Roof
- Vinyl Siding
Interior Spaces
- 1,291 Sq Ft Home
- Property has 1 Level
- Ceiling Fan
- Wood Burning Fireplace
- Washer and Dryer Hookup
Kitchen
- Oven
- Range
- Microwave
- Dishwasher
Bedrooms and Bathrooms
- 3 Bedrooms
- 2 Full Bathrooms
- Soaking Tub
Parking
- 2 Parking Spaces
- Driveway
Schools
- Mayfield Elementary School
- Slidell Middle School
- Slidell High School
Utilities
- Central Heating and Cooling System
- Treatment Plant
Additional Features
- Covered Patio or Porch
- Outside City Limits
Community Details
- Ozone Woods Subdivision
Listing and Financial Details
- Tax Lot 1
- Assessor Parcel Number 107259
Map
Home Values in the Area
Average Home Value in this Area
Tax History
| Year | Tax Paid | Tax Assessment Tax Assessment Total Assessment is a certain percentage of the fair market value that is determined by local assessors to be the total taxable value of land and additions on the property. | Land | Improvement |
|---|---|---|---|---|
| 2025 | $1,919 | $14,970 | $2,250 | $12,720 |
| 2024 | $1,919 | $14,970 | $2,250 | $12,720 |
| 2023 | $1,997 | $11,322 | $1,500 | $9,822 |
| 2022 | $168,850 | $11,322 | $1,500 | $9,822 |
| 2021 | $1,686 | $11,322 | $1,500 | $9,822 |
| 2020 | $1,678 | $11,322 | $1,500 | $9,822 |
| 2019 | $1,648 | $10,716 | $750 | $9,966 |
| 2018 | $1,654 | $10,716 | $750 | $9,966 |
| 2017 | $1,665 | $10,716 | $750 | $9,966 |
| 2016 | $1,702 | $10,716 | $750 | $9,966 |
| 2015 | $1,796 | $11,003 | $1,600 | $9,403 |
| 2014 | $1,762 | $11,003 | $1,600 | $9,403 |
| 2013 | -- | $11,003 | $1,600 | $9,403 |
Property History
| Date | Event | Price | List to Sale | Price per Sq Ft | Prior Sale |
|---|---|---|---|---|---|
| 02/28/2026 02/28/26 | Pending | -- | -- | -- | |
| 02/05/2026 02/05/26 | Price Changed | $167,500 | -2.9% | $130 / Sq Ft | |
| 12/29/2025 12/29/25 | Price Changed | $172,500 | -4.1% | $134 / Sq Ft | |
| 12/02/2025 12/02/25 | For Sale | $179,900 | 0.0% | $139 / Sq Ft | |
| 02/23/2024 02/23/24 | Rented | $1,500 | 0.0% | -- | |
| 02/06/2024 02/06/24 | For Rent | $1,500 | +30.4% | -- | |
| 11/09/2019 11/09/19 | Rented | $1,150 | -4.2% | -- | |
| 10/10/2019 10/10/19 | Under Contract | -- | -- | -- | |
| 09/12/2019 09/12/19 | For Rent | $1,200 | +4.3% | -- | |
| 06/26/2018 06/26/18 | For Rent | $1,150 | 0.0% | -- | |
| 06/26/2018 06/26/18 | Rented | $1,150 | +15.0% | -- | |
| 05/05/2014 05/05/14 | For Rent | $1,000 | 0.0% | -- | |
| 05/05/2014 05/05/14 | Rented | $1,000 | 0.0% | -- | |
| 03/01/2013 03/01/13 | For Rent | $1,000 | 0.0% | -- | |
| 03/01/2013 03/01/13 | Rented | $1,000 | 0.0% | -- | |
| 01/18/2013 01/18/13 | Sold | -- | -- | -- | View Prior Sale |
| 12/19/2012 12/19/12 | Pending | -- | -- | -- | |
| 08/02/2012 08/02/12 | For Sale | $119,000 | -- | $91 / Sq Ft |
Purchase History
| Date | Type | Sale Price | Title Company |
|---|---|---|---|
| Sheriffs Deed | $58,334 | None Available |
Source: ROAM MLS
MLS Number: 2532976
APN: 107259

Ask me questions while you tour the home.