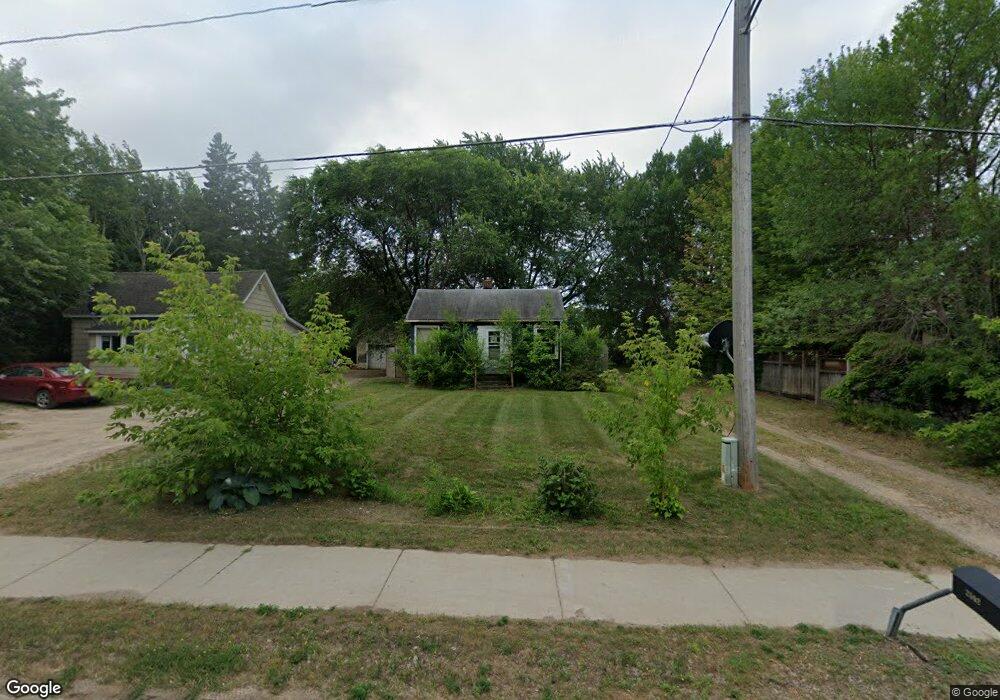
2502 Oak St Brainerd, MN 56401
Estimated Value: $132,660 - $187,000
2
Beds
1
Bath
569
Sq Ft
$268/Sq Ft
Est. Value
About This Home
This home is located at 2502 Oak St, Brainerd, MN 56401 and is currently estimated at $152,415, approximately $267 per square foot. 2502 Oak St is a home located in Crow Wing County with nearby schools including Harrison Elementary School, Forestview Middle School, and Brainerd Senior High School.
Ownership History
Date
Name
Owned For
Owner Type
Purchase Details
Closed on
Aug 2, 2017
Sold by
Tretter and Ronald
Bought by
Niesen Matthew
Current Estimated Value
Purchase Details
Closed on
Sep 1, 2010
Sold by
Mizelle Laura L and Mizelle Kelly L
Bought by
Green Jessica L
Purchase Details
Closed on
Feb 1, 2007
Sold by
Stewart Wayne A
Bought by
Mizelle Laura L and Mizelle Kelly L
Purchase Details
Closed on
May 1, 1999
Sold by
Bleecker Roberta L
Bought by
Stewart Wayne A
Purchase Details
Closed on
Aug 1, 1993
Sold by
Bourassa Ricky
Bought by
Bleecker George
Create a Home Valuation Report for This Property
The Home Valuation Report is an in-depth analysis detailing your home's value as well as a comparison with similar homes in the area
Home Values in the Area
Average Home Value in this Area
Purchase History
We collect this data history from publicly available records. To have your information removed, we recommend requesting removal directly through your county’s website.
| Date | Buyer | Sale Price | Title Company |
|---|---|---|---|
| Niesen Matthew | $55,000 | -- | |
| Green Jessica L | $42,000 | -- | |
| Mizelle Laura L | $54,900 | -- | |
| Stewart Wayne A | $24,000 | -- | |
| Bleecker George | $18,500 | -- |
Source: Public Records
Tax History
| Year | Tax Paid | Tax Assessment Tax Assessment Total Assessment is a certain percentage of the fair market value that is determined by local assessors to be the total taxable value of land and additions on the property. | Land | Improvement |
|---|---|---|---|---|
| 2025 | $808 | $108,200 | $48,800 | $59,400 |
| 2024 | $722 | $100,500 | $46,100 | $54,400 |
| 2023 | $560 | $90,800 | $42,500 | $48,300 |
| 2022 | $554 | $75,200 | $34,400 | $40,800 |
| 2021 | $584 | $59,000 | $30,500 | $28,500 |
| 2020 | $582 | $60,200 | $31,000 | $29,200 |
| 2019 | $574 | $57,100 | $31,000 | $26,100 |
| 2018 | $524 | $55,600 | $31,000 | $24,600 |
| 2017 | $480 | $32,100 | $18,600 | $13,500 |
| 2016 | $416 | $25,500 | $15,300 | $10,200 |
| 2015 | $370 | $22,600 | $12,300 | $10,300 |
| 2014 | $166 | $22,000 | $11,500 | $10,500 |
Source: Public Records
Map
Nearby Homes
Your Personal Tour Guide
Ask me questions while you tour the home.