2503 W 800 S Warren, IN 46792
Estimated Value: $201,000 - $284,000
1
Bed
1
Bath
728
Sq Ft
$331/Sq Ft
Est. Value
About This Home
This home is located at 2503 W 800 S, Warren, IN 46792 and is currently estimated at $241,196, approximately $331 per square foot. 2503 W 800 S is a home located in Huntington County with nearby schools including Lancaster Elementary School and Huntington North High School.
Ownership History
Date
Name
Owned For
Owner Type
Purchase Details
Closed on
Aug 30, 2017
Sold by
Bell Virginia L
Bought by
Harlan Robert W and Harlan Erin L
Current Estimated Value
Home Financials for this Owner
Home Financials are based on the most recent Mortgage that was taken out on this home.
Original Mortgage
$150,000
Outstanding Balance
$116,643
Interest Rate
3.93%
Mortgage Type
Future Advance Clause Open End Mortgage
Estimated Equity
$124,553
Purchase Details
Closed on
Nov 9, 2015
Sold by
Bell Virginia L and Bell Amanda M
Bought by
Bell Virginia L
Purchase Details
Closed on
Aug 24, 2006
Sold by
Bell Virginia L
Bought by
Bell Virginia L and Bell Amanda M
Create a Home Valuation Report for This Property
The Home Valuation Report is an in-depth analysis detailing your home's value as well as a comparison with similar homes in the area
Home Values in the Area
Average Home Value in this Area
Purchase History
| Date | Buyer | Sale Price | Title Company |
|---|---|---|---|
| Harlan Robert W | -- | None Available | |
| Bell Virginia L | -- | Attorney | |
| Bell Virginia L | -- | None Available |
Source: Public Records
Mortgage History
| Date | Status | Borrower | Loan Amount |
|---|---|---|---|
| Open | Harlan Robert W | $150,000 |
Source: Public Records
Tax History Compared to Growth
Tax History
| Year | Tax Paid | Tax Assessment Tax Assessment Total Assessment is a certain percentage of the fair market value that is determined by local assessors to be the total taxable value of land and additions on the property. | Land | Improvement |
|---|---|---|---|---|
| 2024 | $1,641 | $193,000 | $69,300 | $123,700 |
| 2023 | $2,002 | $193,000 | $69,300 | $123,700 |
| 2022 | $1,953 | $195,600 | $69,300 | $126,300 |
| 2021 | $1,983 | $182,400 | $66,300 | $116,100 |
| 2020 | $2,011 | $180,500 | $61,400 | $119,100 |
| 2019 | $1,733 | $168,400 | $61,400 | $107,000 |
| 2018 | $1,731 | $162,000 | $61,400 | $100,600 |
| 2017 | $1,545 | $160,800 | $61,400 | $99,400 |
| 2016 | $1,483 | $162,600 | $61,400 | $101,200 |
| 2014 | $1,494 | $160,500 | $61,400 | $99,100 |
| 2013 | $1,494 | $159,500 | $61,400 | $98,100 |
Source: Public Records
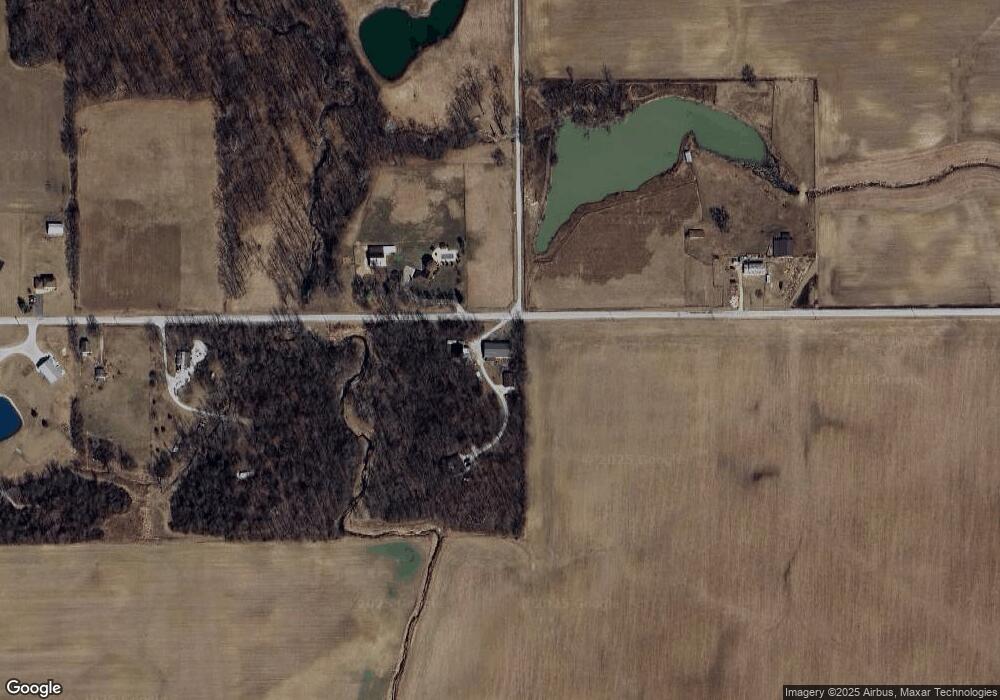
Map
Nearby Homes