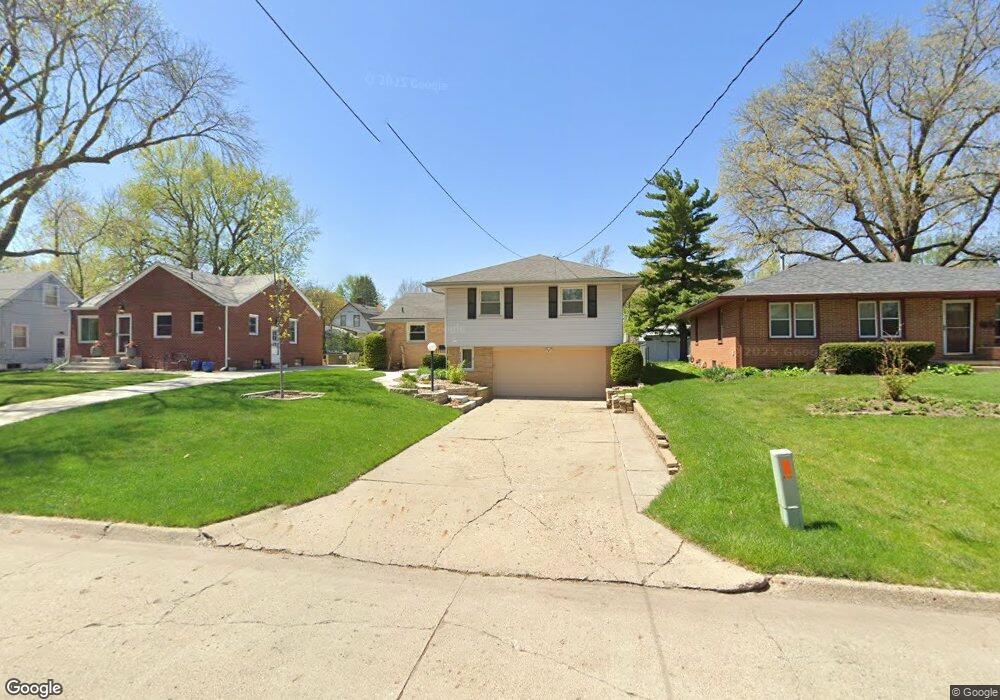
2504 48th Place Des Moines, IA 50310
Beaverdale NeighborhoodEstimated Value: $260,000 - $277,000
3
Beds
1
Bath
1,470
Sq Ft
$181/Sq Ft
Est. Value
About This Home
This home is located at 2504 48th Place, Des Moines, IA 50310 and is currently estimated at $266,502, approximately $181 per square foot. 2504 48th Place is a home located in Polk County with nearby schools including Hillis Elementary School, Meredith Middle School, and Hoover High School.
Ownership History
Date
Name
Owned For
Owner Type
Purchase Details
Closed on
Jan 11, 2022
Sold by
Todd Madden Michael
Bought by
Madden Michael T and Magnee Ally
Current Estimated Value
Home Financials for this Owner
Home Financials are based on the most recent Mortgage that was taken out on this home.
Original Mortgage
$171,600
Outstanding Balance
$135,902
Interest Rate
3.12%
Mortgage Type
New Conventional
Estimated Equity
$130,600
Purchase Details
Closed on
Jan 4, 2022
Sold by
Todd Madden Michael
Bought by
Madden Michael T and Magnee Ally
Home Financials for this Owner
Home Financials are based on the most recent Mortgage that was taken out on this home.
Original Mortgage
$171,600
Outstanding Balance
$135,902
Interest Rate
3.12%
Mortgage Type
New Conventional
Estimated Equity
$130,600
Purchase Details
Closed on
Apr 1, 2020
Sold by
Simpson David P
Bought by
Madden Michael Todd
Home Financials for this Owner
Home Financials are based on the most recent Mortgage that was taken out on this home.
Original Mortgage
$171,950
Interest Rate
3.4%
Mortgage Type
New Conventional
Purchase Details
Closed on
Mar 26, 2020
Sold by
Simpson David P
Bought by
Madden Michael Todd
Home Financials for this Owner
Home Financials are based on the most recent Mortgage that was taken out on this home.
Original Mortgage
$171,950
Interest Rate
3.4%
Mortgage Type
New Conventional
Purchase Details
Closed on
Apr 25, 2018
Sold by
Halverson Steven K and Martin Phyllis
Bought by
Simpson David P
Home Financials for this Owner
Home Financials are based on the most recent Mortgage that was taken out on this home.
Original Mortgage
$174,503
Interest Rate
4.45%
Mortgage Type
New Conventional
Purchase Details
Closed on
Oct 12, 2007
Sold by
Cunningham Arlene J
Bought by
Halverson Steven K and Martin Phyllis
Home Financials for this Owner
Home Financials are based on the most recent Mortgage that was taken out on this home.
Original Mortgage
$130,000
Interest Rate
6.5%
Mortgage Type
Purchase Money Mortgage
Create a Home Valuation Report for This Property
The Home Valuation Report is an in-depth analysis detailing your home's value as well as a comparison with similar homes in the area
Home Values in the Area
Average Home Value in this Area
Purchase History
| Date | Buyer | Sale Price | Title Company |
|---|---|---|---|
| Madden Michael T | -- | None Listed On Document | |
| Madden Michael T | -- | None Listed On Document | |
| Madden Michael Todd | $181,000 | None Available | |
| Madden Michael Todd | $181,000 | None Available | |
| Simpson David P | $180,000 | None Available | |
| Halverson Steven K | $166,500 | None Available |
Source: Public Records
Mortgage History
| Date | Status | Borrower | Loan Amount |
|---|---|---|---|
| Open | Madden Michael T | $171,600 | |
| Closed | Madden Michael T | $171,600 | |
| Previous Owner | Madden Michael Todd | $171,950 | |
| Previous Owner | Madden Michael Todd | $171,950 | |
| Previous Owner | Simpson David P | $174,503 | |
| Previous Owner | Halverson Steven K | $130,000 |
Source: Public Records
Tax History Compared to Growth
Tax History
| Year | Tax Paid | Tax Assessment Tax Assessment Total Assessment is a certain percentage of the fair market value that is determined by local assessors to be the total taxable value of land and additions on the property. | Land | Improvement |
|---|---|---|---|---|
| 2025 | $4,096 | $242,900 | $51,000 | $191,900 |
| 2024 | $4,096 | $218,700 | $45,200 | $173,500 |
| 2023 | $4,142 | $218,700 | $45,200 | $173,500 |
| 2022 | $4,108 | $184,600 | $39,300 | $145,300 |
| 2021 | $5,232 | $184,600 | $39,300 | $145,300 |
| 2020 | $5,432 | $218,300 | $36,200 | $182,100 |
| 2019 | $4,984 | $218,300 | $36,200 | $182,100 |
| 2018 | $4,840 | $194,000 | $31,500 | $162,500 |
| 2017 | $4,560 | $194,000 | $31,500 | $162,500 |
| 2016 | $4,436 | $180,400 | $28,700 | $151,700 |
| 2015 | $4,436 | $180,400 | $28,700 | $151,700 |
| 2014 | $4,228 | $177,400 | $27,900 | $149,500 |
Source: Public Records
Map
Nearby Homes