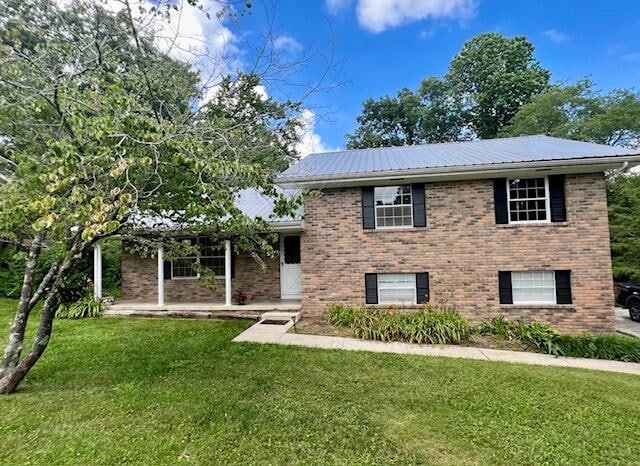
2505 Dowler Cir Signal Mountain, TN 37377
Highlights
- Deck
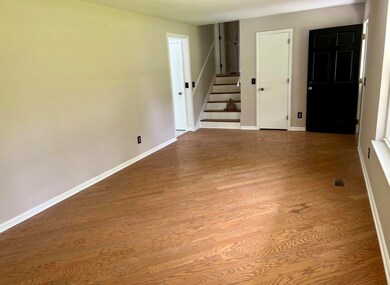
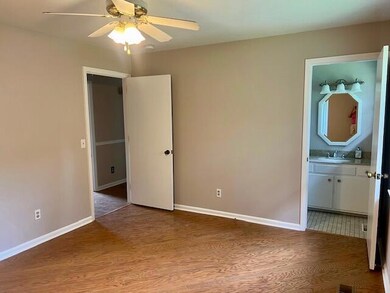
- Wood Flooring
- Den
- Nolan Elementary School Rated A-
- No HOA
- 1.5 Car Attached Garage
About This Home
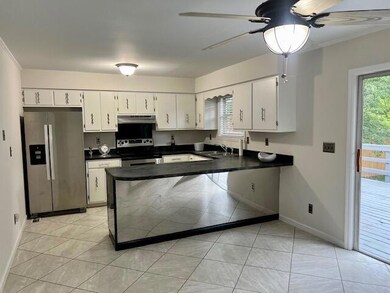
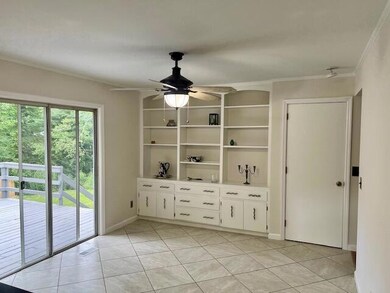
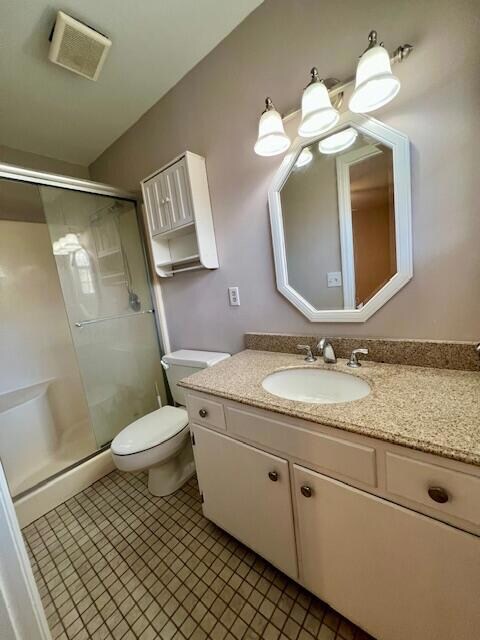
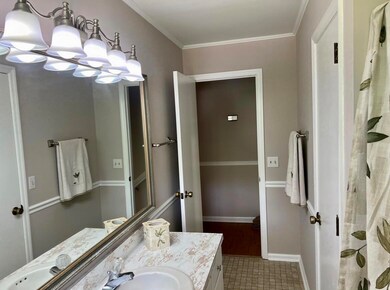
Gorgeous and pristine, this updated brick home offers 3 bedrooms, 2 baths, and fresh renovations throughout, including a newly installed primary shower. Wood floors flow through the living area & bedrooms, and the bright kitchen features stainless steel appliances, ample counter space, and a window overlooking the sunny backyard. The dining area includes a custom built-in and opens to a freshly painted deck with built-in seating. Enjoy a ;arge yard with an in-ground fire pit and storage shed. The lower level offers a versatile bonus room and a new laundry closet with washer/dryer included. An oversized garage-and-a-half provides excellent storage and workspace, and the home is equipped with a recently installed HVAC system. Located in a quiet, walkable neighborhood zoned for top-rated Signal Mountain schools and convenient to both downtown Chattanooga and Hwy 153. Perfect blend of comfort, updates, and convenience on beautiful Dowler Circle. Tenant is responsible for all utilities, trash removal, lawn and landscaping maintenance. Small dogs will be considered on a case by case basis.
Listing Agent
Real Estate Partners Chattanooga LLC License #376980 Listed on: 11/26/2025

Home Details
Home Type
- Single Family
Year Built
- Built in 1977 | Remodeled
Lot Details
- 0.3 Acre Lot
- Lot Dimensions are 100x134.45
- Wood Fence
- Back Yard
Parking
- 1.5 Car Attached Garage
- Side Facing Garage
- Driveway
Home Design
- Block Foundation
Interior Spaces
- 1,346 Sq Ft Home
- 2-Story Property
- Living Room
- Den
- Wood Flooring
- Finished Basement
- Laundry in Basement
Kitchen
- Eat-In Kitchen
- Electric Range
- Dishwasher
Bedrooms and Bathrooms
- 3 Bedrooms
- Primary bedroom located on second floor
- 2 Full Bathrooms
- Bathtub with Shower
Laundry
- Laundry Room
- Washer and Dryer
Eco-Friendly Details
- Non-Toxic Pest Control
Outdoor Features
- Deck
- Outdoor Gas Grill
Schools
- Nolan Elementary School
- Signal Mountain Middle School
- Signal Mtn High School
Utilities
- Central Heating and Cooling System
- Septic Tank
Listing and Financial Details
- Property Available on 11/24/25
- The owner pays for pest control
- Negotiable Lease Term
- Available 11/24/25
- Assessor Parcel Number 079m B 011
Community Details
Overview
- No Home Owners Association
- Dowler Hgts Subdivision
Pet Policy
- Limit on the number of pets
- Pet Size Limit
- Dogs Allowed
Map
Source: Greater Chattanooga REALTORS®
MLS Number: 1524560
APN: 079M-B-011
Disclaimer: Certain information contained herein is derived from information provided by parties other than Homes.com. All information provided is deemed reliable, but is not guaranteed to be accurate and should be independently verified.
![]() IDX information is provided exclusively for consumers’ personal, noncommercial use, that it may not be used for any purpose other than to identify prospective properties consumers may be interested in purchasing.
IDX information is provided exclusively for consumers’ personal, noncommercial use, that it may not be used for any purpose other than to identify prospective properties consumers may be interested in purchasing.
Data is deemed reliable but is not guaranteed accurate by the MLS.
Ten-X does not display the entire MLS of Chattanooga, Inc. database on this website. The listings of some real estate brokerage firms have been excluded. Some or all of the listings displayed may not belong to the firm whose website is being visited
Copyright© 2025 by Chattanooga Association of REALTORS®
- 4505 Taft Hwy
- 2610 Eagle Creek Way
- Farmview Plan at Hidden River
- Augustus Plan at Hidden River
- Summerbrook Plan at Hidden River
- Autumnbrook Plan at Hidden River
- Winterbrook Plan at Hidden River
- Carolina Plan at Hidden River
- 4276 Taft Hwy
- 4218 Hidden River Ln
- 2232 Fairmount Rd W
- 2307 Covington Cove Ln
- Laurel Plan at The Sanctuary at Signal Forest
- Wellesley Plan at The Sanctuary at Signal Forest
- Chestnut Hill Plan at The Sanctuary at Signal Forest
- Stillwater Plan at The Sanctuary at Signal Forest
- Waterford Plan at The Sanctuary at Signal Forest
- Lynden Plan at The Sanctuary at Signal Forest
- New Haven Plan at The Sanctuary at Signal Forest
- Willow Creek Plan at The Sanctuary at Signal Forest
- 629 Parsons Ln
- 7155 Sawyer Rd
- 104 Sunnybrook Trail
- 5563 Stream Ln
- 5559 Stream Ln
- 5468 Abby Grace Loop
- 650 Moonlit Trail
- 4126 Mountain Creek Rd
- 815 Fairmount Ave
- 312 Signal Mountain Blvd
- 4053 Priceless View
- 3535 Mountain Creek Rd
- 3985 N Quail Ln Unit 3
- 3131 Mountain Creek Rd
- 4081 Blue Water Cir
- 85 Flash Way
- 4130 Mountain View Ave
- 4805 Dyno Loop
- 4885 Dyno Loop
- 4927 Dyno Loop