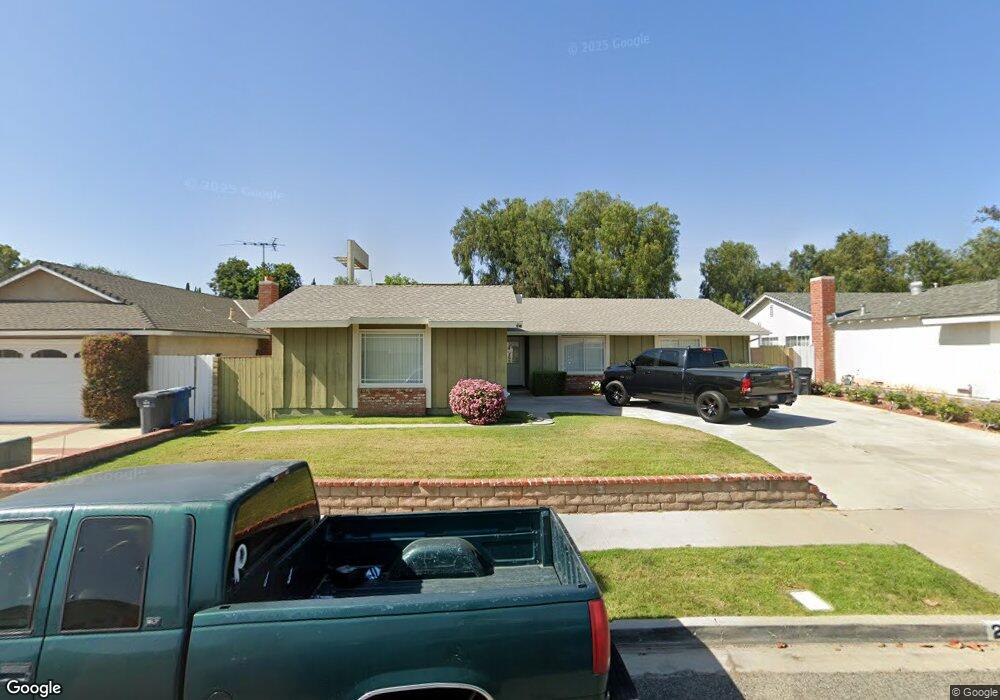
2505 E Phyllis St Simi Valley, CA 93065
Central Simi Valley NeighborhoodEstimated Value: $735,000 - $792,000
3
Beds
2
Baths
1,650
Sq Ft
$460/Sq Ft
Est. Value
About This Home
This home is located at 2505 E Phyllis St, Simi Valley, CA 93065 and is currently estimated at $758,393, approximately $459 per square foot. 2505 E Phyllis St is a home located in Ventura County with nearby schools including Park View Elementary School, Hillside Middle School, and Royal High School.
Ownership History
Date
Name
Owned For
Owner Type
Purchase Details
Closed on
Mar 21, 2016
Sold by
Vivolo Wayne W and Vivolo Helena M
Bought by
The Vivolo Family Trust and Vivolo Helena
Current Estimated Value
Purchase Details
Closed on
Oct 5, 1998
Sold by
Stanley Higa and Stanley Kenneth T
Bought by
Vivolo Wayne W and Vivolo Helena M
Home Financials for this Owner
Home Financials are based on the most recent Mortgage that was taken out on this home.
Original Mortgage
$156,250
Interest Rate
6.73%
Purchase Details
Closed on
Apr 18, 1996
Sold by
Nakameejo Roy and Nakamaejo Lorraine M
Bought by
Higa Stanley and Nakamaejo Kenneth T
Home Financials for this Owner
Home Financials are based on the most recent Mortgage that was taken out on this home.
Original Mortgage
$100,000
Interest Rate
8.18%
Create a Home Valuation Report for This Property
The Home Valuation Report is an in-depth analysis detailing your home's value as well as a comparison with similar homes in the area
Home Values in the Area
Average Home Value in this Area
Purchase History
| Date | Buyer | Sale Price | Title Company |
|---|---|---|---|
| The Vivolo Family Trust | -- | None Available | |
| Vivolo Wayne W | $164,500 | Fidelity National Title | |
| Higa Stanley | $100,000 | Old Republic Title Company |
Source: Public Records
Mortgage History
| Date | Status | Borrower | Loan Amount |
|---|---|---|---|
| Previous Owner | Vivolo Wayne W | $156,250 | |
| Previous Owner | Higa Stanley | $100,000 |
Source: Public Records
Tax History
| Year | Tax Paid | Tax Assessment Tax Assessment Total Assessment is a certain percentage of the fair market value that is determined by local assessors to be the total taxable value of land and additions on the property. | Land | Improvement |
|---|---|---|---|---|
| 2025 | $3,741 | $282,153 | $112,857 | $169,296 |
| 2024 | $3,741 | $276,621 | $110,644 | $165,977 |
| 2023 | $3,515 | $271,198 | $108,475 | $162,723 |
| 2022 | $3,480 | $265,881 | $106,348 | $159,533 |
| 2021 | $3,436 | $260,668 | $104,263 | $156,405 |
| 2020 | $3,352 | $257,997 | $103,195 | $154,802 |
| 2019 | $3,196 | $252,939 | $101,172 | $151,767 |
| 2018 | $3,156 | $247,981 | $99,189 | $148,792 |
| 2017 | $3,076 | $243,120 | $97,245 | $145,875 |
| 2016 | $2,933 | $238,354 | $95,339 | $143,015 |
| 2015 | $2,861 | $234,776 | $93,908 | $140,868 |
| 2014 | $2,809 | $230,178 | $92,069 | $138,109 |
Source: Public Records
Map
Nearby Homes
- 2516 E Phyllis St
- 2718 Licia Place
- 2752 Wanda Ave
- 2325 Wisteria St
- 2781 N Woodrow Ave
- 2671 Coral Gum Ln
- 2235 Clover St
- 2183 E Chesterton St
- 2357 Lawnview Ct
- 2385 N Justin Ave
- 2832 Thicket Place
- 2756 N Dalenhurst Place
- 3067 Harrison Ln
- 3010 Tallahassee Ln
- 3049 Tallahassee Ln
- 2189 Latham St
- 3028 Harrison Ln
- 2146 N Brower St
- 2497 Orangewood Place
- 2239 McDonald St
- 2517 E Phyllis St
- 2491 E Phyllis St
- 2533 E Phyllis St
- 2479 E Phyllis St
- 2478 E Phyllis St
- 2490 E Phyllis St
- 2466 E Phyllis St
- 2547 E Phyllis St
- 2467 E Phyllis St
- 2526 E Phyllis St
- 2454 E Phyllis St
- 2561 E Phyllis St
- 2467 Marie St
- 2445 E Phyllis St
- 2543 Marie St
- 2455 Marie St
- 2532 E Phyllis St
- 2442 E Phyllis St
- 2559 Marie St
- 2575 E Phyllis St
Your Personal Tour Guide
Ask me questions while you tour the home.