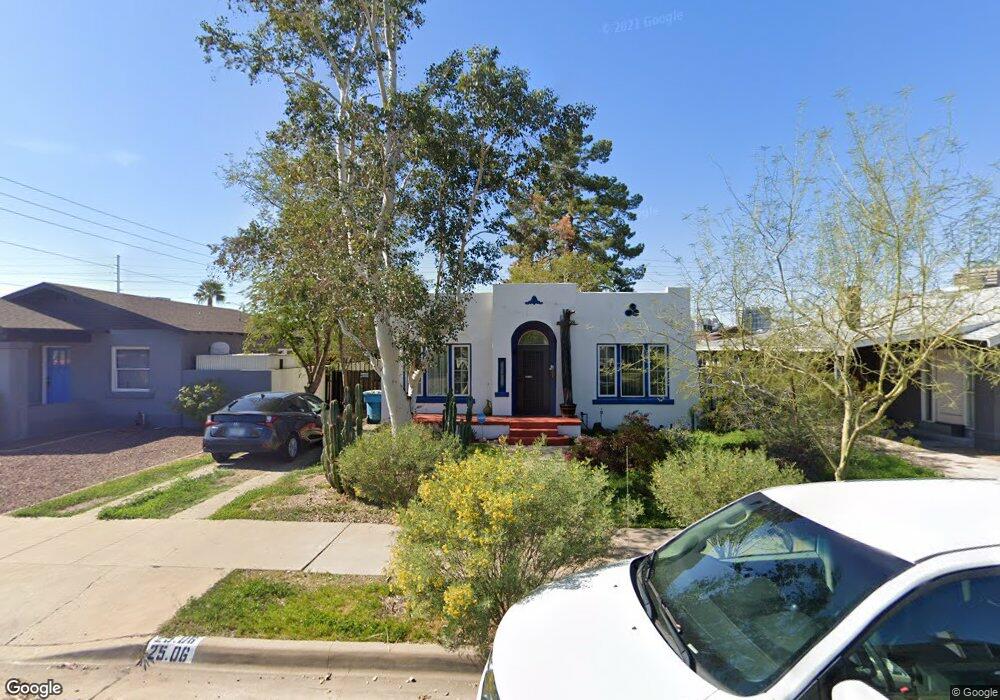
2506 N 8th St Phoenix, AZ 85006
Coronado NeighborhoodEstimated Value: $400,395 - $604,000
Studio
1
Bath
1,115
Sq Ft
$443/Sq Ft
Est. Value
About This Home
This home is located at 2506 N 8th St, Phoenix, AZ 85006 and is currently estimated at $493,849, approximately $442 per square foot. 2506 N 8th St is a home located in Maricopa County with nearby schools including Emerson Elementary School, North High School, and Phoenix Coding Academy.
Ownership History
Date
Name
Owned For
Owner Type
Purchase Details
Closed on
Jan 16, 2002
Sold by
Swigard Anne L
Bought by
Buckwalter Jan
Current Estimated Value
Home Financials for this Owner
Home Financials are based on the most recent Mortgage that was taken out on this home.
Original Mortgage
$144,000
Outstanding Balance
$58,007
Interest Rate
6.84%
Mortgage Type
New Conventional
Estimated Equity
$435,842
Purchase Details
Closed on
Dec 28, 1998
Sold by
Cruz Steven R and Cruz Erica E
Bought by
Swigard Anne L
Home Financials for this Owner
Home Financials are based on the most recent Mortgage that was taken out on this home.
Original Mortgage
$96,000
Interest Rate
6.82%
Mortgage Type
New Conventional
Purchase Details
Closed on
Jan 4, 1996
Sold by
Mcleod Donald R and Mcleod Rose Mary
Bought by
Cruz Steven R and Cruz Erica E
Home Financials for this Owner
Home Financials are based on the most recent Mortgage that was taken out on this home.
Original Mortgage
$87,618
Interest Rate
7.25%
Mortgage Type
VA
Create a Home Valuation Report for This Property
The Home Valuation Report is an in-depth analysis detailing your home's value as well as a comparison with similar homes in the area
Home Values in the Area
Average Home Value in this Area
Purchase History
| Date | Buyer | Sale Price | Title Company |
|---|---|---|---|
| Buckwalter Jan | $160,000 | Equity Title Agency Inc | |
| Swigard Anne L | $120,000 | Security Title Agency | |
| Cruz Steven R | $85,900 | Security Title Agency |
Source: Public Records
Mortgage History
| Date | Status | Borrower | Loan Amount |
|---|---|---|---|
| Open | Buckwalter Jan | $144,000 | |
| Previous Owner | Swigard Anne L | $96,000 | |
| Previous Owner | Cruz Steven R | $87,618 |
Source: Public Records
Tax History
| Year | Tax Paid | Tax Assessment Tax Assessment Total Assessment is a certain percentage of the fair market value that is determined by local assessors to be the total taxable value of land and additions on the property. | Land | Improvement |
|---|---|---|---|---|
| 2025 | $982 | $6,914 | -- | -- |
| 2024 | $916 | $6,585 | -- | -- |
| 2023 | $916 | $17,685 | $3,535 | $14,150 |
| 2022 | $883 | $14,365 | $2,870 | $11,495 |
| 2021 | $876 | $12,615 | $2,520 | $10,095 |
| 2020 | $887 | $12,315 | $2,460 | $9,855 |
| 2019 | $885 | $11,060 | $2,210 | $8,850 |
| 2018 | $870 | $9,165 | $1,830 | $7,335 |
| 2017 | $850 | $8,780 | $1,755 | $7,025 |
| 2016 | $825 | $7,575 | $1,515 | $6,060 |
| 2015 | $764 | $6,960 | $1,390 | $5,570 |
Source: Public Records
Map
Nearby Homes
- 2505 N Richland St
- 2546 N 9th St
- 2241 N Richland St
- 2237 N Richland St Unit 6
- 377 E Windsor Ave Unit 6
- 377 E Windsor Ave Unit 21
- 377 E Windsor Ave Unit 1
- 377 E Windsor Ave Unit 7
- 2709 N 7th St
- 2525 N 10th St
- 531 E Roanoke Ave Unit A
- 2636 N Dayton St
- 2336 N 11th St
- 312 E Windsor Ave Unit 13
- 312 E Windsor Ave Unit 2
- 312 E Windsor Ave Unit 4
- 2310 N 11th St
- 349 E Thomas Rd Unit E407
- 349 E Thomas Rd Unit E302
- 351 E Thomas Rd Unit D208
- 2510 N 8th St
- 2502 N 8th St
- 2514 N 8th St
- 2505 N 7th St
- 2518 N 8th St
- 2340 N 8th St Unit 102
- 2340 N 8th St Unit 100
- 2501 N 8th St
- 2509 N 8th St Unit MAIN
- 2509 N 8th St Unit REAR
- 2509 N 8th St
- 2522 N 8th St
- 2515 N 8th St
- 801 E Sheridan St
- 2341 N 8th St
- 2526 N 8th St
- 2521 N 8th St
- 2334 N 8th St
- 809 E Sheridan St
- 2333 N 8th St Unit 40
Your Personal Tour Guide
Ask me questions while you tour the home.