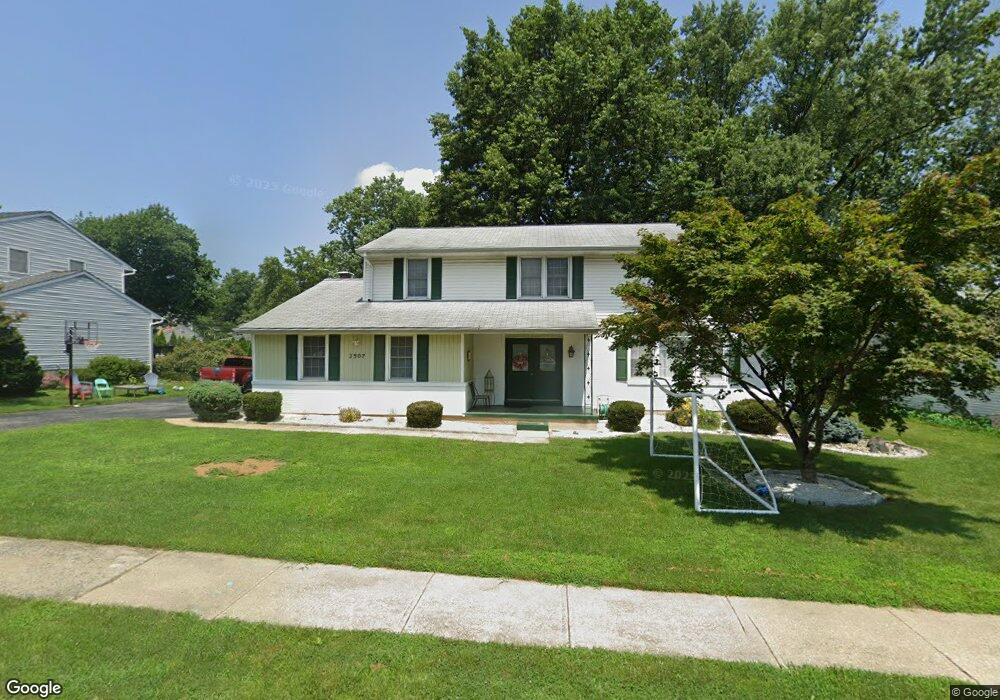
2507 Raven Rd Wilmington, DE 19810
Talleyville NeighborhoodEstimated Value: $538,000 - $596,000
4
Beds
3
Baths
1,764
Sq Ft
$320/Sq Ft
Est. Value
About This Home
This home is located at 2507 Raven Rd, Wilmington, DE 19810 and is currently estimated at $563,850, approximately $319 per square foot. 2507 Raven Rd is a home located in New Castle County with nearby schools including Hanby Elementary School, Springer Middle School, and Concord High School.
Ownership History
Date
Name
Owned For
Owner Type
Purchase Details
Closed on
Jul 24, 2018
Sold by
Feng Andrew A and Feng Shirley Y
Bought by
Quinn Brendan P
Current Estimated Value
Home Financials for this Owner
Home Financials are based on the most recent Mortgage that was taken out on this home.
Original Mortgage
$335,550
Outstanding Balance
$291,447
Interest Rate
4.6%
Mortgage Type
New Conventional
Estimated Equity
$272,403
Purchase Details
Closed on
Aug 1, 1984
Bought by
Feng Andy A and Feng Shirley Y
Create a Home Valuation Report for This Property
The Home Valuation Report is an in-depth analysis detailing your home's value as well as a comparison with similar homes in the area
Home Values in the Area
Average Home Value in this Area
Purchase History
| Date | Buyer | Sale Price | Title Company |
|---|---|---|---|
| Quinn Brendan P | -- | None Available | |
| Feng Andy A | $106,000 | -- |
Source: Public Records
Mortgage History
| Date | Status | Borrower | Loan Amount |
|---|---|---|---|
| Open | Quinn Brendan P | $335,550 |
Source: Public Records
Tax History Compared to Growth
Tax History
| Year | Tax Paid | Tax Assessment Tax Assessment Total Assessment is a certain percentage of the fair market value that is determined by local assessors to be the total taxable value of land and additions on the property. | Land | Improvement |
|---|---|---|---|---|
| 2024 | $3,589 | $94,300 | $17,700 | $76,600 |
| 2023 | $3,280 | $94,300 | $17,700 | $76,600 |
| 2022 | $3,336 | $94,300 | $17,700 | $76,600 |
| 2021 | $3,336 | $94,300 | $17,700 | $76,600 |
| 2020 | $3,336 | $94,300 | $17,700 | $76,600 |
| 2019 | $3,447 | $94,300 | $17,700 | $76,600 |
| 2018 | $3,188 | $94,300 | $17,700 | $76,600 |
| 2017 | $3,139 | $94,300 | $17,700 | $76,600 |
| 2016 | $3,137 | $94,300 | $17,700 | $76,600 |
| 2015 | $2,886 | $94,300 | $17,700 | $76,600 |
| 2014 | $2,885 | $94,300 | $17,700 | $76,600 |
Source: Public Records
Map
Nearby Homes