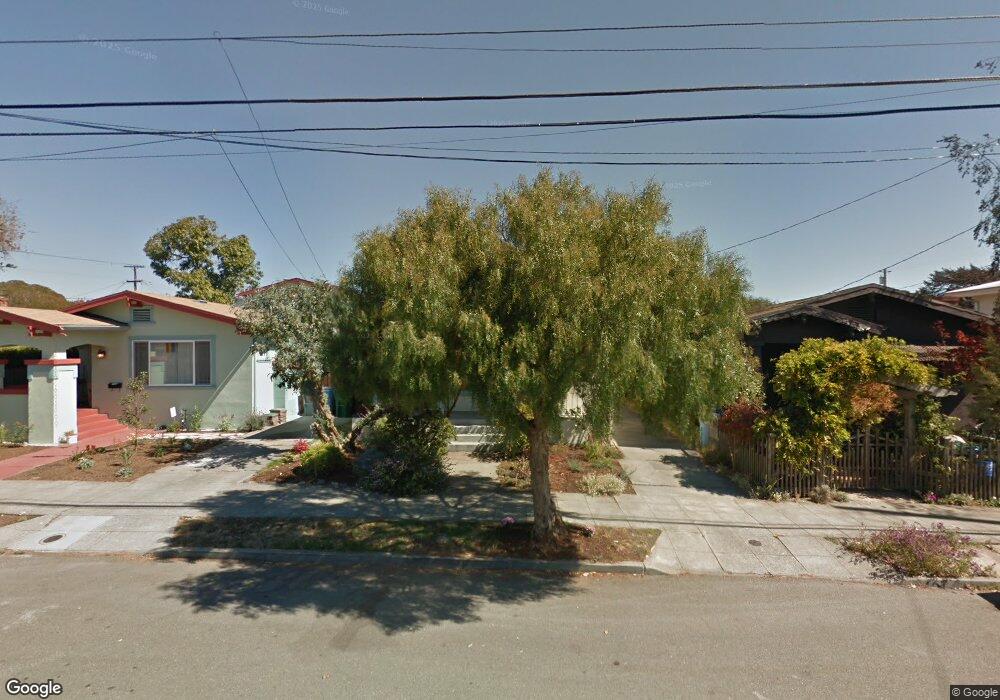
2509 Acton St Berkeley, CA 94702
West Berkeley NeighborhoodEstimated Value: $789,000 - $1,238,000
2
Beds
1
Bath
1,056
Sq Ft
$1,006/Sq Ft
Est. Value
About This Home
This home is located at 2509 Acton St, Berkeley, CA 94702 and is currently estimated at $1,062,297, approximately $1,005 per square foot. 2509 Acton St is a home located in Alameda County with nearby schools including Washington Elementary School, Oxford Elementary School, and Malcolm X Elementary School.
Ownership History
Date
Name
Owned For
Owner Type
Purchase Details
Closed on
Feb 18, 2020
Sold by
Levano Steven Phyllix and Nyhan Kathleen Elizabeth
Bought by
Levano Steven Phyllix and Nyhan Kathleen Elizabeth
Current Estimated Value
Home Financials for this Owner
Home Financials are based on the most recent Mortgage that was taken out on this home.
Original Mortgage
$305,000
Outstanding Balance
$270,056
Interest Rate
3.6%
Mortgage Type
New Conventional
Estimated Equity
$792,241
Purchase Details
Closed on
Aug 6, 2001
Sold by
Gifford Adam and Hester Ingrid C
Bought by
Levano Steve and Nyhan Kathleen
Home Financials for this Owner
Home Financials are based on the most recent Mortgage that was taken out on this home.
Original Mortgage
$347,812
Interest Rate
7.1%
Mortgage Type
Stand Alone First
Create a Home Valuation Report for This Property
The Home Valuation Report is an in-depth analysis detailing your home's value as well as a comparison with similar homes in the area
Home Values in the Area
Average Home Value in this Area
Purchase History
| Date | Buyer | Sale Price | Title Company |
|---|---|---|---|
| Levano Steven Phyllix | -- | Old Republic Title Company | |
| Levano Steve | $371,000 | Chicago Title Co |
Source: Public Records
Mortgage History
| Date | Status | Borrower | Loan Amount |
|---|---|---|---|
| Open | Levano Steven Phyllix | $305,000 | |
| Closed | Levano Steve | $347,812 |
Source: Public Records
Tax History
| Year | Tax Paid | Tax Assessment Tax Assessment Total Assessment is a certain percentage of the fair market value that is determined by local assessors to be the total taxable value of land and additions on the property. | Land | Improvement |
|---|---|---|---|---|
| 2025 | $8,628 | $541,040 | $164,412 | $383,628 |
| 2024 | $8,628 | $530,296 | $161,189 | $376,107 |
| 2023 | $8,444 | $526,764 | $158,029 | $368,735 |
| 2022 | $8,285 | $509,434 | $154,930 | $361,504 |
| 2021 | $8,297 | $499,310 | $151,893 | $354,417 |
| 2020 | $7,847 | $501,120 | $150,336 | $350,784 |
| 2019 | $7,530 | $491,296 | $147,389 | $343,907 |
| 2018 | $7,399 | $481,664 | $144,499 | $337,165 |
| 2017 | $7,122 | $472,223 | $141,667 | $330,556 |
| 2016 | $6,885 | $462,967 | $138,890 | $324,077 |
| 2015 | $6,792 | $456,014 | $136,804 | $319,210 |
| 2014 | $6,741 | $447,084 | $134,125 | $312,959 |
Source: Public Records
Map
Nearby Homes
- 2350 Sacramento St
- 1515 Derby St
- 1612 Parker St
- 1142 Dwight Way
- 2750 Sacramento St
- 1450 Ward St
- 2758 Sacramento St
- 1612 Carleton St
- 2774 Sacramento St
- 1118 Dwight Way
- 2782 Sacramento St
- 2790 Sacramento St
- 2324 Browning St
- 1645 Dwight Way
- 1530 Stuart St
- 1092 Dwight Way
- 2751 Wallace St
- 2747 San Pablo Ave Unit 507
- 1039 Channing Way
- 2231 Byron St
- 2511 Acton St
- 2505 Acton St
- 1405 Blake St
- 1401 Blake St
- 1411 Blake St
- 1406 Dwight Way
- 1408 Dwight Way
- 1402 Dwight Way
- 1410 Dwight Way
- 1420 Dwight Way
- 2510 Acton St
- 2500 Acton St
- 2508 Acton St
- 1430 Dwight Way
- 1345 Blake St
- 1406 Blake St
- 1441 Blake St
- 1390 Dwight Way
- 1440 Dwight Way
- 1352 Blake St Unit Downstairs
Your Personal Tour Guide
Ask me questions while you tour the home.